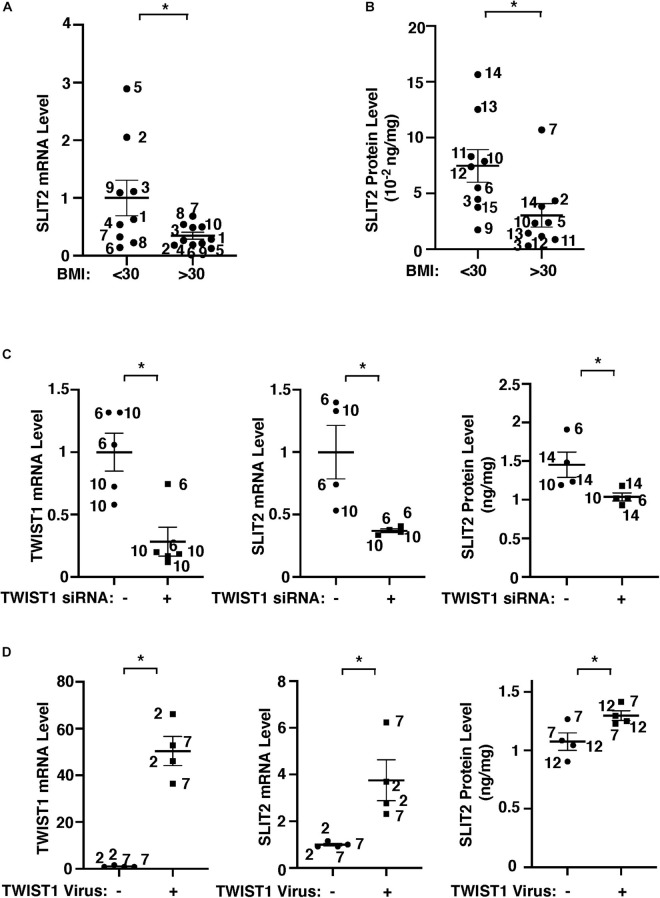
FIGURE 2.
TWIST1 controls SLIT2 expression in lean vs. obese adipose ECs. (A) Graph showing SLIT2 mRNA expression in lean vs. obese human adipose ECs (n = 9–10, mean ± SEM, *p < 0.05). (B) Graph showing SLIT2 protein expression in lean vs. obese human adipose tissues (n = 9, mean ± SEM, *p < 0.05). (C) Graphs showing mRNA expression of TWIST1 and SLIT2 in lean human adipose ECs treated with TWIST1 siRNA or control siRNA with irrelevant sequences (n = 4–5, mean ± SEM, *p < 0.05). Graph showing protein expression of SLIT2 in lean human adipose ECs treated with TWIST1 siRNA or control siRNA with irrelevant sequences (n = 4, mean ± SEM, *p < 0.05). (D) Graphs showing mRNA expression of TWIST1 and SLIT2 in obese human adipose ECs treated with lentivirus overexpressing TWIST1 or control virus (n = 4, mean ± SEM, *p < 0.05). Graph showing protein expression of SLIT2 in obese human adipose ECs treated with lentivirus overexpressing TWIST1 or control virus (n = 4, mean ± SEM, *p < 0.05). The numbers along the dots correspond to the clone numbers in Table 1.

