
Figure 2.
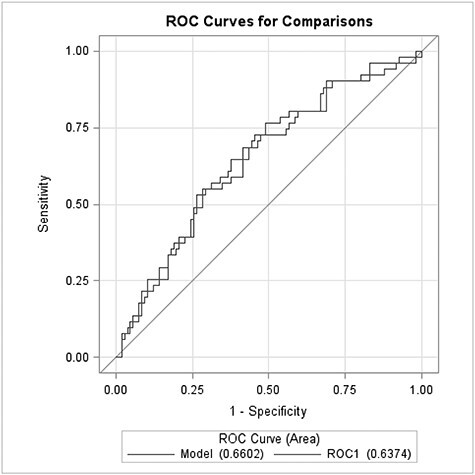
Visualization of the ROC analysis with the linearly combined CLOCK and CRY2 transcripts. The blue line represents the nonvalidated ROC curve (AUC=0.66, 95% CI=0.57–0.75, P = 0.0005, ref.: by chance) for the combined transcripts. The red line represents the cross-validated ROC curve (AUC=0.64, 95% CI=0.54–0.73) for the combined transcripts.