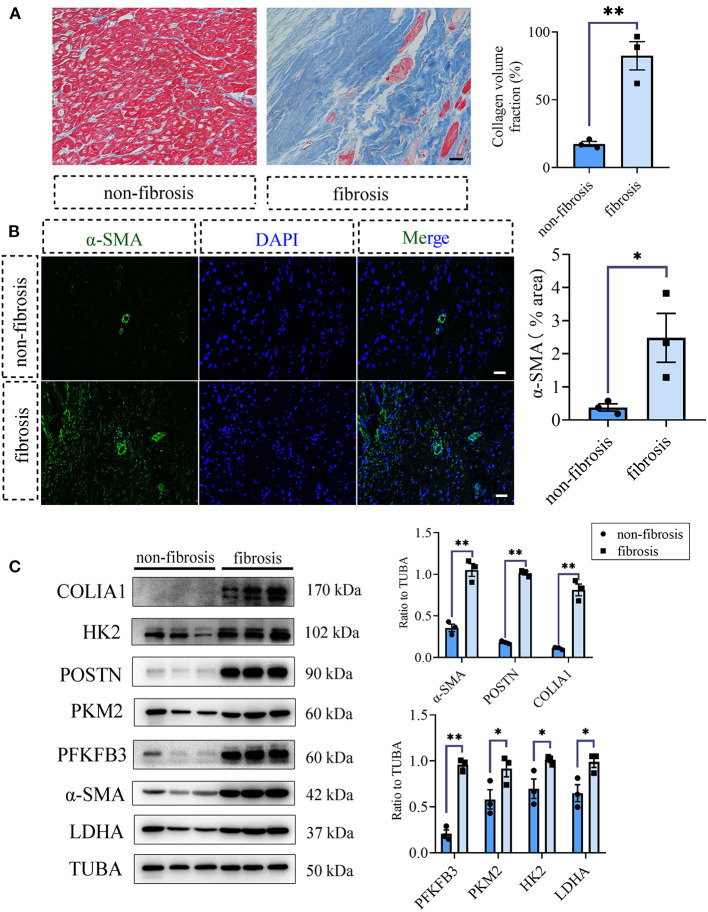
Figure 5.
Glycolysis increased in human fibrotic heart tissues compared with the non-fibrotic heart tissues. (A) Masson staining of the human fibrotic and non-fibrotic heart tissues. The representative image (left) and the statistical analysis (right) were shown. (B) Immunofluorescence of the human fibrotic and non-fibrotic heart tissues. The green fluorescence signal represented α-SMA, and the blue fluorescence signal represented DAPI. (C) Western blot of the expressions of glycolytic and CF activation markers of the human fibrotic and non-fibrotic heart tissues. The representative image (left) and the statistical analysis (right) were shown, respectively. N = 3; *P < 0.05; **P < 0.01; ns, no significance. Scale bar = 100 μm.

