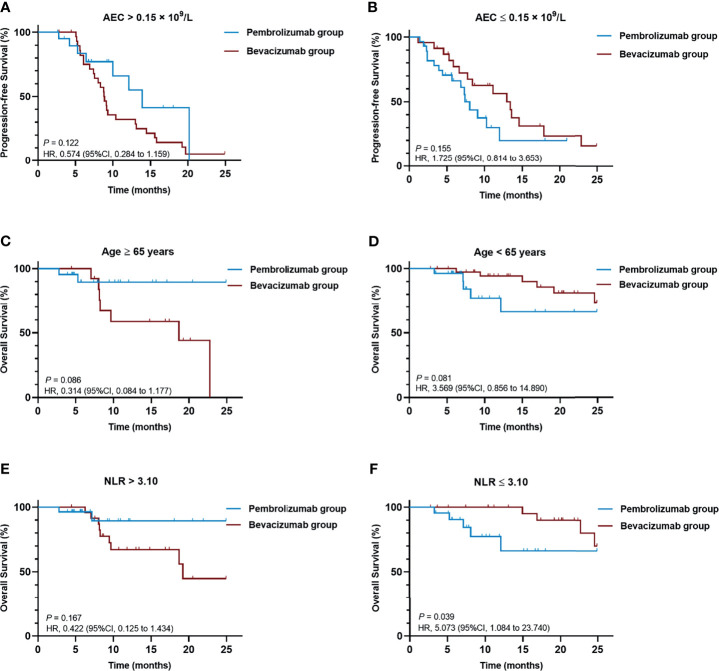
Figure 2.
Kaplan-Meier curves of (A) PFS of patients with baseline AEC > 0.15 × 10⁹/L, (B) PFS of patients with baseline AEC ≤ 0.15 × 10⁹/L, (C) OS of patients aged ≥ 65 years, (D) OS of patients aged < 65 years, (E) OS of patients with baseline NLR >3.10, (F) OS of patients with baseline NLR ≤ 3.10. AEC, absolute eosinophil count; CI, confidence interval; HR, hazard ratio; NLR, neutrophil-to-lymphocyte ratio; OS, overall survival; PFS, progression-free survival.

