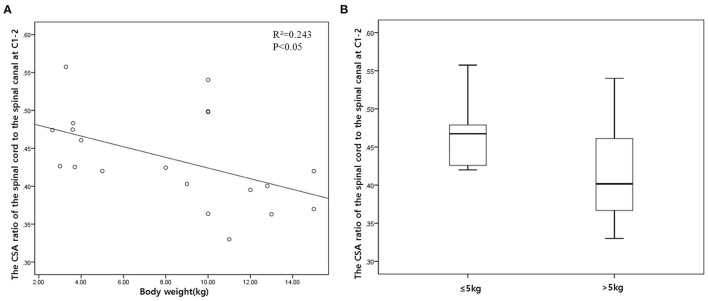
Figure 3.
(A) Scatter plot and linear regression for the cross-sectional area (CSA) ratio of the spinal cord to the spinal canal (the CSA ratio) in relation to body weight at C1–C2. (B) Box plot of the CSA ratio at C1–C2 compared by dividing the dogs into two groups: dogs ≤5 kg (eight dogs) and dogs >5 kg (12 dogs).

