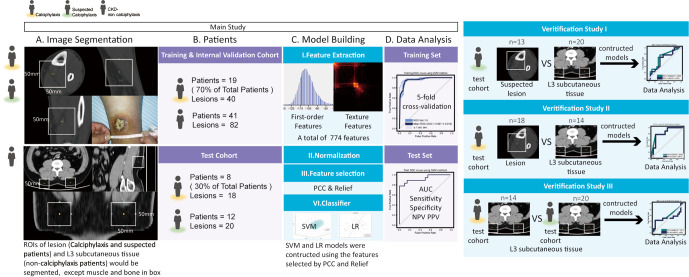
Figure 1.
Flow chart of main study and verification studies. AUC, areas under the ROC curves; CKD, chronic kidney disease; LR, logistic regression; SVM, support vector machine; ROI, region of interest; PPV, positive predictive value; NPV, negative predictive value; ROC, receiver operating characteristic; PCC, Pearson correlation coefficient.

