
Figure 3.
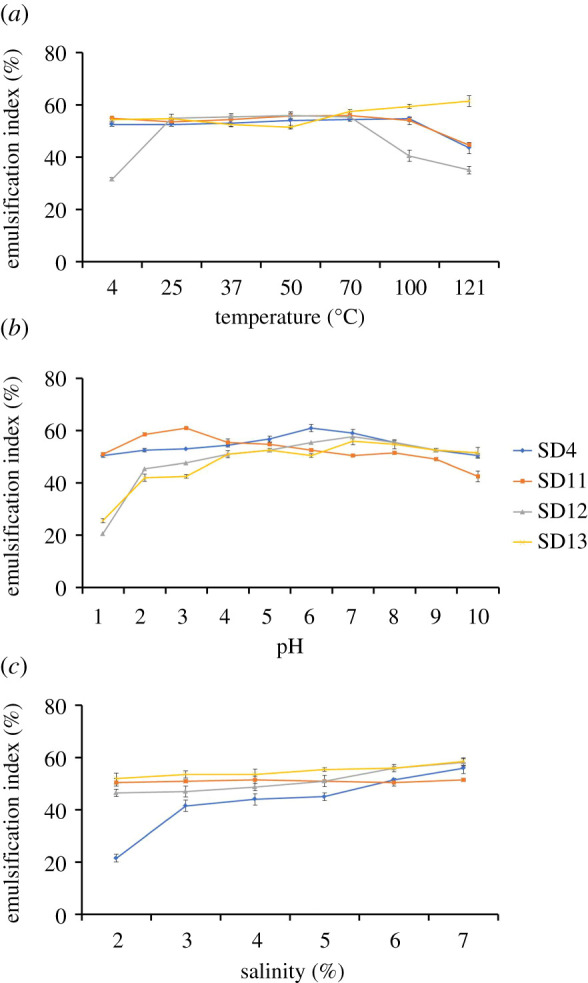
Stability of the biosurfactants at various (a) temperature, (b) pH and (c) salinity. The error bars represent one standard deviation of the mean, n = 3.
Official websites use .gov
A
.gov website belongs to an official
government organization in the United States.
Secure .gov websites use HTTPS
A lock (
) or https:// means you've safely
connected to the .gov website. Share sensitive
information only on official, secure websites.
Stability of the biosurfactants at various (a) temperature, (b) pH and (c) salinity. The error bars represent one standard deviation of the mean, n = 3.