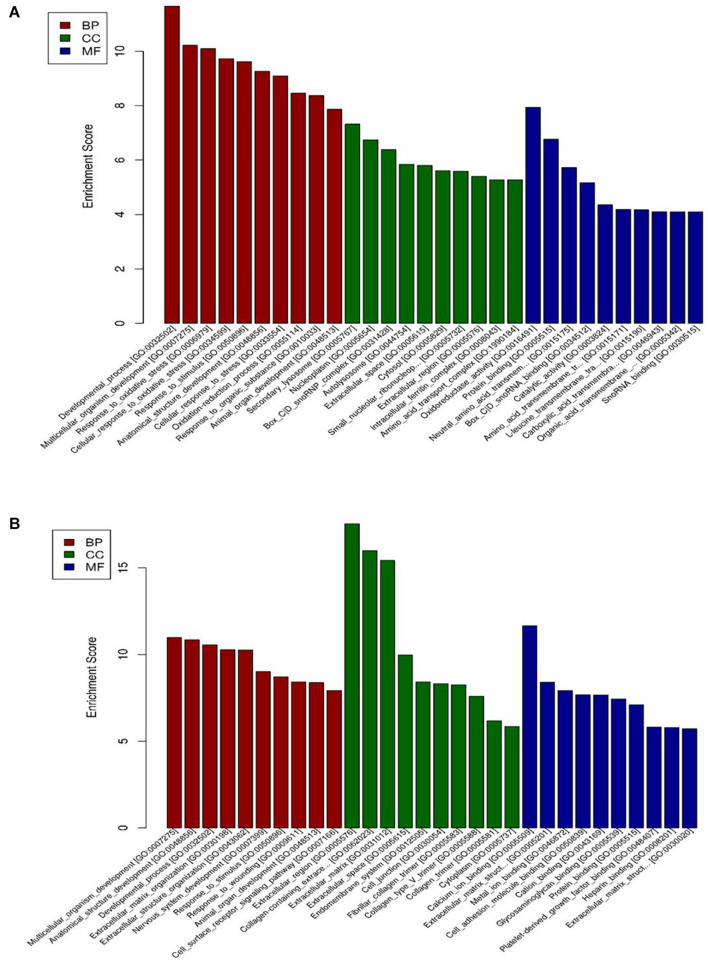
FIGURE 3.
GO enrichment-based clustering analysis of the differentially expressed genes in BAECs (n = 3). (A) The top 10 GO terms associated with upregulated genes in the CSE group compared with the control group; (B) the top 10 GO terms associated with downregulated genes in the CSE group compared with the control group. CSE, cigarette smoke extract; BAEC, bronchoalveolar epithelial cells; CC, Cellular component analysis; BP, Biological process analysis; MF, Molecular function analysis.

