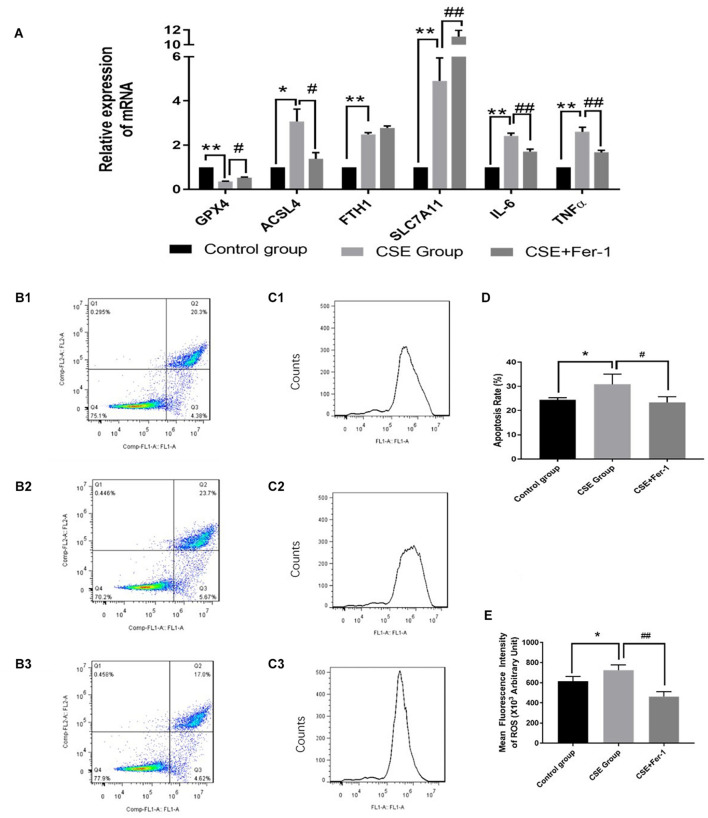
FIGURE 5.
Effects of ferrostatin-1 on mRNA expression levels, apoptosis rates and ROS levels (n = 3). (A) GPX4, ACSL4, FTH1, SLC7A11, IL6 and TNF-α mRNA levels in control group, CSE group and CSE + ferrostatin-1 group of BAECs. (B1–3,D) The apoptosis rate in control group, CSE group and CSE + ferrostatin-1 group of BAECs. (C1–3,E) ROS levels in control group, CSE group and CSE + ferrostatin-1 group of BAECs. CSE, cigarette smoke extract; BAEC, bronchoalveolar epithelial cells. **p < 0.01 compared with the control group; *p < 0.05 compared with the control group; ##p < 0.01 compared with the CSE group; #p < 0.05 compared with the CSE group.

