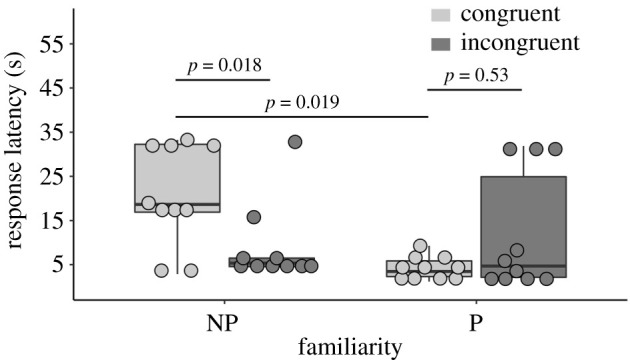
Figure 2.

Focal penguins' response latency at the first and second call. The horizontal lines within the boxplot indicate the median. The boxes extend from the lower to the upper quartile and the whiskers indicate the interquartile range above the upper quartile (max) or below the lower quartile (min). Each filled circle represents the average response latency of an individual penguin. NP, non-partner colony-mate; P, partner.
