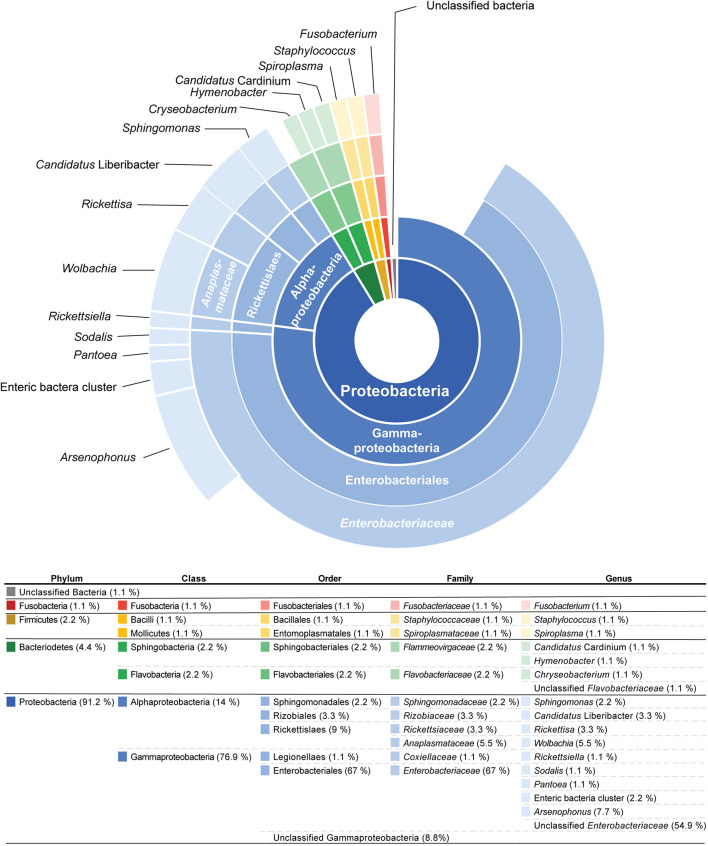
FIGURE 1.
The sunburst diagram above represents the percentage of 91 operational taxonomic units (OTUs) from 44 psyllid species (from 45 psyllid samples) that belong to a particular taxonomic group. The ring positions of the diagram represents taxonomic hierarchy: (inner to outer) Phylum/Class/Order/Family/Genus.

