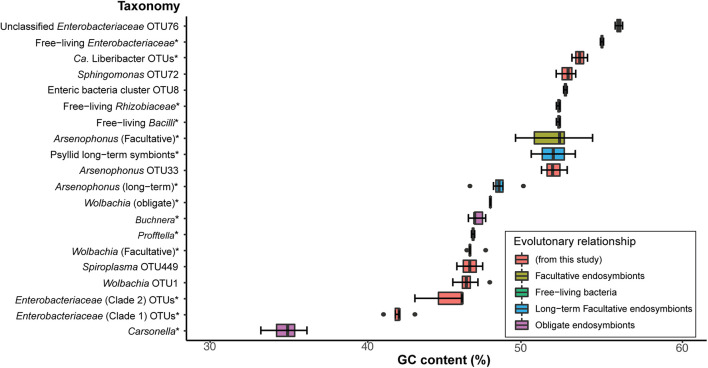
FIGURE 2.
Comparison of GC contents from a 429-nt 16S rRNA gene region obtained from endosymbiont taxa of known insect host associations (obligate, long-term, and facultative), free-living bacterial relatives, and a selection of OTUs from this study. * indicates that detailed OTU and NCBI sequence and species information is available in Supplementary Table 2. Percent GC content for all 16S rRNA sequence data are also presented in Supplementary Table 2. Box and whisker plots represent average percent GC content and the standard deviation.

