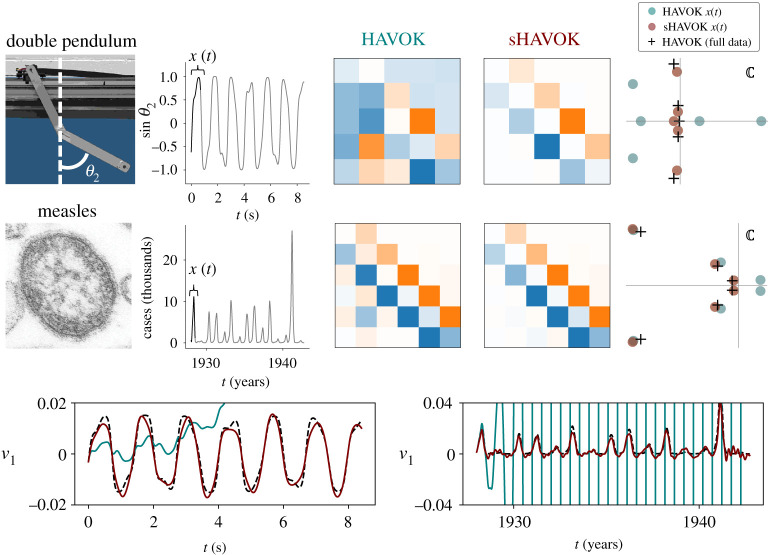
Figure 9.
Comparison of HAVOK and structured HAVOK (sHAVOK) for two real-world systems: a double pendulum and measles outbreak data. For each system, we measure a trajectory extracting a single coordinate (grey). We then apply HAVOK and sHAVOK to a subset of this trajectory, shown in black. The matrices for the resulting linear dynamical models are shown. sHAVOK yields models with an antisymmetric structure, with non-zero elements only along the sub-diagonal and super-diagonal. The corresponding eigenvalue spectra for HAVOK and sHAVOK are additionally plotted in teal and maroon, respectively, along with eigenvalues from HAVOK for a long trajectory. In both cases, the eigenvalues of sHAVOK are much closer in value to those in the long trajectory limit than HAVOK. Some of the eigenvalues of HAVOK are unstable and have positive real components. The corresponding reconstructions of the first singular vector of the corresponding Hankel matrices are shown along with the real data. Note that the HAVOK models are unstable, growing exponentially due to the unstable eigenvalues, while the sHAVOK models do not. Credit for images on left: (double pendulum) [83] and (measles) CDC/Cynthia S. Goldsmith; William Bellini, PhD. (Online version in colour.)

