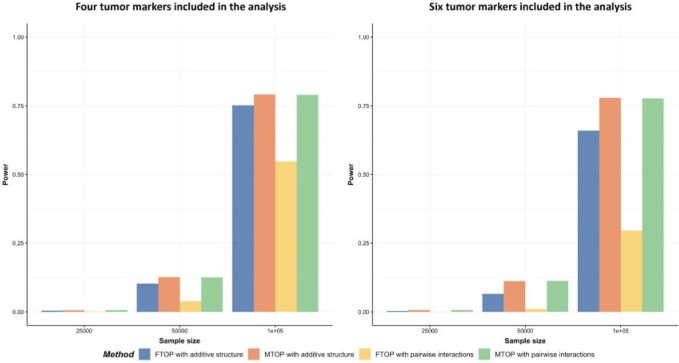
Fig. 2.
Power comparison of global association test with pairwise interactions. Four methods were evaluated, including FTOP with additive structure, MTOP with additive structure (ER fixed), FTOP with pairwise interactions and MTOP with pairwise interactions (ER fixed). For the three figures in the first row, four tumor markers were included in the analysis. Three binary tumor marker and one ordinal tumor marker defined 24 cancer subtypes. Around  cases were incomplete. For the three figures in the second row, two extra binary tumor markers were included in the analysis. The six tumor markers defined 96 subtypes. Around
  cases were incomplete. The total sample size was 25 000, 50 000, and 100 000. We generated
  random replicates. The power was estimated by controlling the type I error
  .
.

