Figure 2.
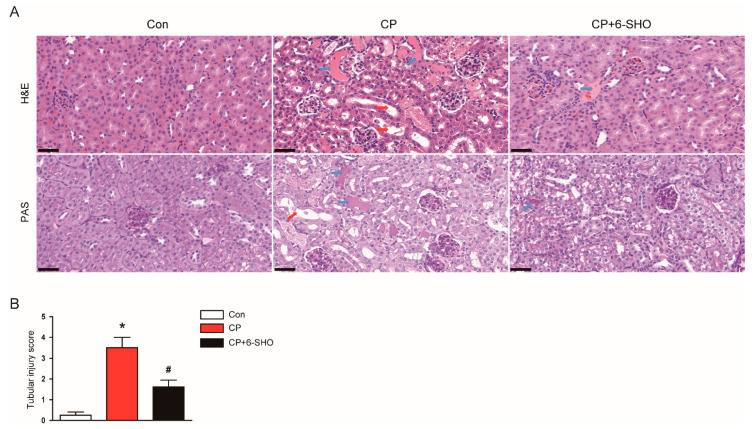
Effect of 6-shogaol on histological abnormalities in cisplatin-treated mice. (A) Representative images of hematoxylin and eosin (H&E) or periodic acid-Schiff (PAS) staining of renal cortex. Scale bar = 40 μm. Red arrows indicate tubular dilatation. Blue arrows indicate cast deposition in the lumens of tubules. (B) Tubular injury was semiquantitatively scored using PAS-stained sections. n = 8 per group of mice. * p < 0.05 versus Con. # p < 0.05 versus CP.

