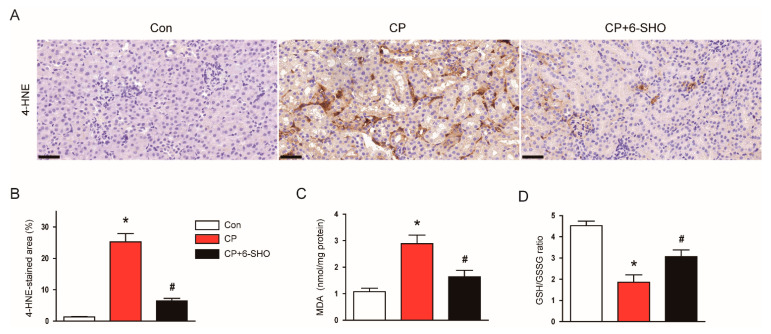
Figure 4.
Effect of 6-shogaol on oxidative stress in cisplatin-treated mice. (A) Representative images of IHC staining for 4-hydroxynonenal (4-HNE). Scale bar = 40 μm. (B) Quantification of positive staining for 4-HNE. (C) Renal levels of malondialdehyde (MDA). (D) Ratio of reduced glutathione (GSH) to oxidized glutathione (GSSG). n = 8 per group of mice. * p < 0.05 versus Con. # p < 0.05 versus CP.

