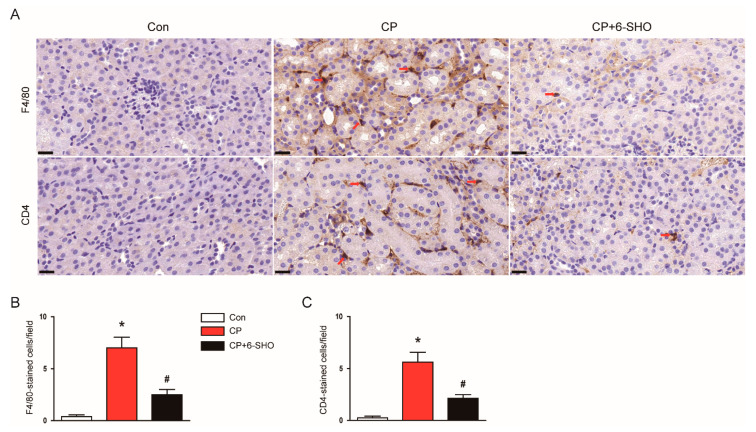
Figure 9.
Effect of 6-shogaol on immune cell infiltration in cisplatin-treated mice. (A) Representative images of IHC staining for F4/80 and CD4. Red arrows indicate positively stained cells. Scale bar = 20 μm. (B) Number of F4/80-stained cells per field. (C) Number of CD4-stained cells per field. n = 8 per group of mice. * p < 0.05 versus Con. # p < 0.05 versus CP.

