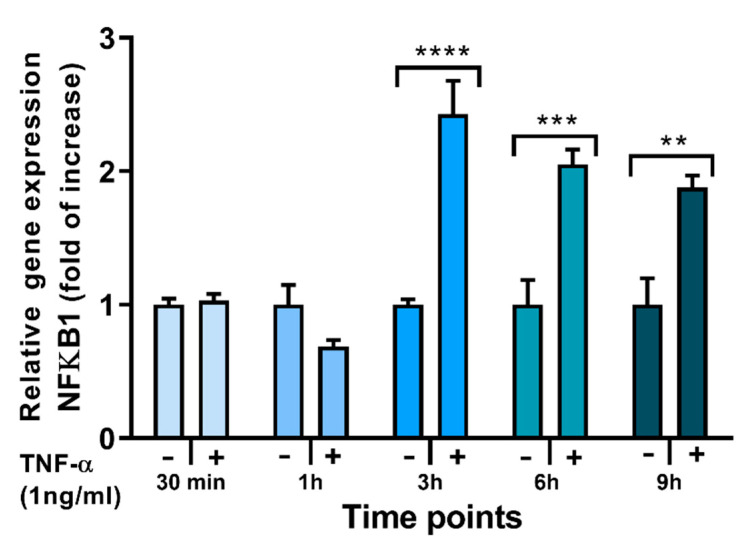
Figure 4.
Expression of the NFκβ1 gene in EA.hy926 cells stimulated (+) with TNF-α (1 ng/mL) for different times up to 9 h or not stimulated (−). Cq values were normalised by the geometric mean of reference targets RPL13A and CYC1 genes. Bars are mean ± SEM of 3 samples from 1 experiment. Stimulated and unstimulated cells were compared at each time point by Student’s t-test. ** p < 0.01, *** p < 0.001, **** p < 0.001 for stimulated vs. unstimulated cells.

