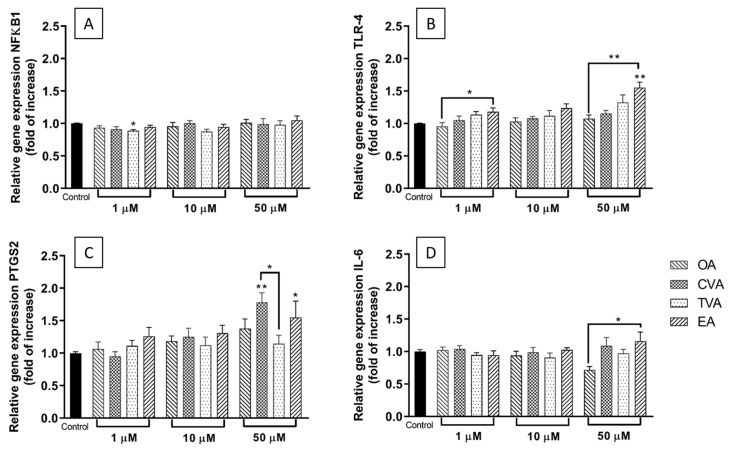
Figure 5.
Expression of NFκβ1 (A), TLR-4 (B), PTGS2 (C), and IL-6 (D) genes in EA.hy926 cells preincubated for 48 h with 1, 10, and 50 µM of FA in DMEM containing 0.1% of ethanol (Control) followed by incubation with TNF-α (1 ng/mL) for 6 h. Cq values were normalised by the geometric mean of reference targets RPL13A and CYC1 genes. Bars are mean ± SEM of 9 samples performed in 3 experiments. Data were analysed using one-way ANOVA with Tukey’s as post hoc test. * p < 0.05, ** p < 0.01 between groups indicated by joined lines or vs. Control when there is no joined line. OA = oleic acid, CVA = cis vaccenic acid, TVA = trans vaccenic acid, EA = elaidic acid.

