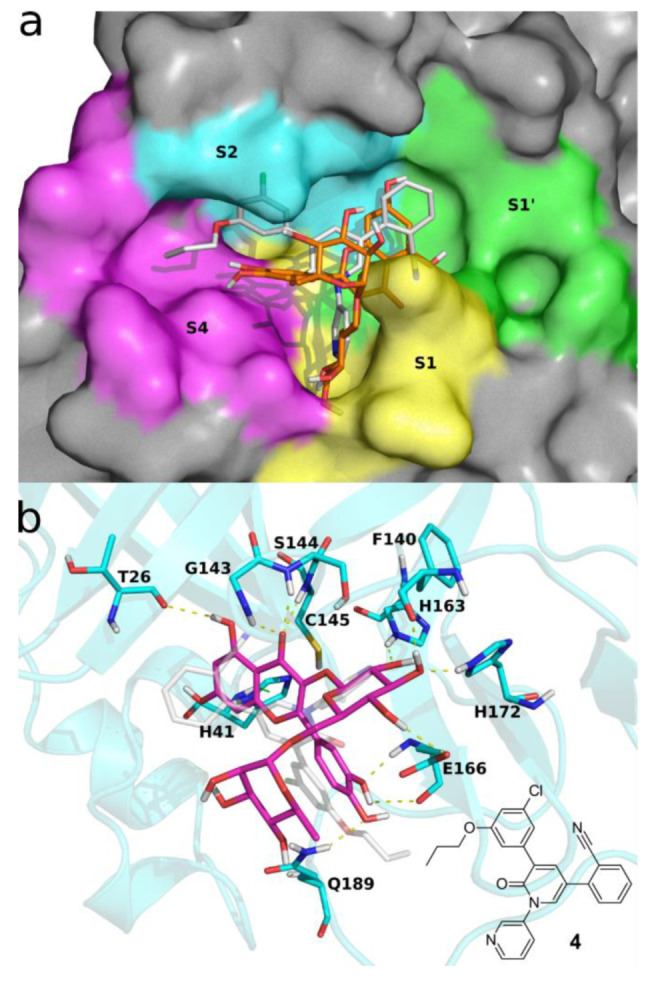
Figure 5.

Docking pose of 1 into SARS-CoV-2 Mpro active site. (a) 1 is shown in orange sticks; the molecular surface of Mpro is colored according to the binding sites S1 (yellow), S1′ (green), S2 (cyan) and S4 (magenta). (b) 1 is represented in magenta sticks and SARS-CoV-2 Mpro in cyan cartoons and sticks; dashed lines represent h-bonds (in yellow) and π-π stacking interactions (in green). Experimental bound conformation of 4 (PDB 7L11) [40] is shown in white sticks for reference in both panels. These figures were made using open source PyMOL v. 1.8.4.0.
