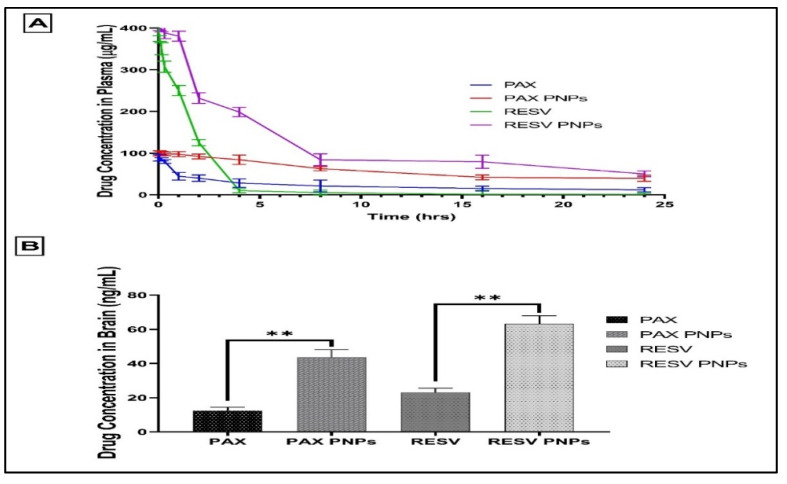
Figure 8.
In vivo pharmacokinetics and brain distribution of PAX-RESV loaded PNPs or free PAX and RESV. (A) The In vivo pharmacokinetics results of PAX-RESV loaded PNPs or free PAX and RESV concentration in Plasma. (B) The In vivo brain distribution results of PAX-RESV loaded PNPs or free PAX and RESV concentration in Brian. ** indicates p < 0.01 results are statistically significant. Data represent the mean± standard deviation (n = 3).

