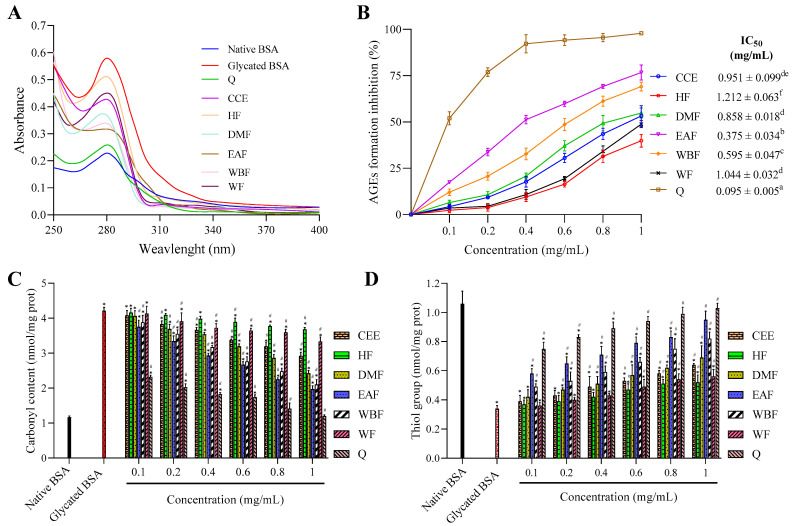
Figure 3.
The effect of CEE and its fractions from E. fragilis extract on the (A) UV–vis absorption spectrum, (B) AGEs formation, (C) carbonyl content, and (D) the level of thiol group in glucose-glycated BSA. All values are expressed as means ± SD, n = 3. Means without a common superscript letter differ (p < 0.05), as analyzed by one-way ANOVA. In the same graph, bars with * represent significantly different from native BSA at p < 0.05 and bars with # represent significantly different from glycated BSA at p < 0.05.

