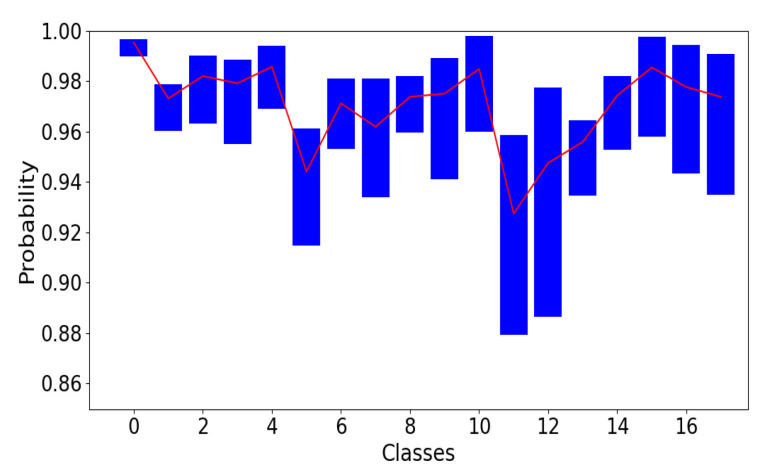
Figure 6.
The 95% confidence interval for correctly predicted images together with the mean. The upper limit is the average value of 97.5th percentile, and the lower limit is the average value of the 2.5th percentile averaged over 300 predictions and all test images in the same class. Confidence interval for prediction probability for the 18 classes. Classes “0” to “17” corresponds to “0” to “I-4, R-4” in Figure 1.

