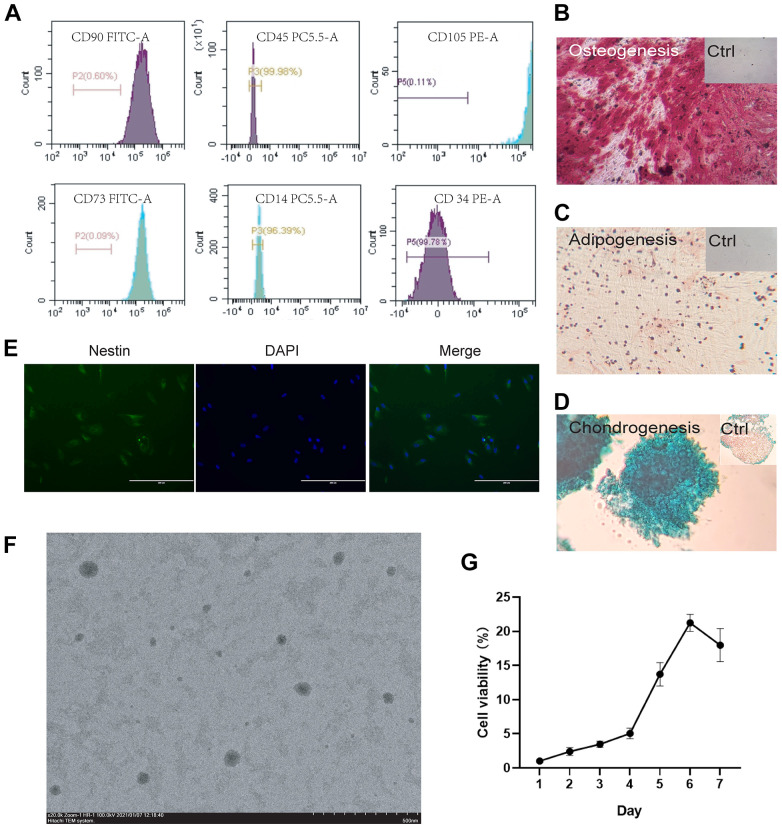
Figure 1.
Identification and characterization of SHED (A) Surface markers of extracted SHED. Flow cytometric analysis showed that isolated cell population highly expressed CD73, CD90, and CD105 while it nearly didn’t express CD14, CD34, and CD45. Isotype samples were used as negative control to delineate positive areas (marked with a horizontal line in the figure.); (B) Osteogenic of SHED. Alizarin red staining of SHED were applied after osteogenic induction for 2–4 weeks. Control group was cultured for the same time in complete medium and stained with Alizarin red; (C) Adipogenic induction of SHED. Oil red staining of SHED were applied after adipogenic induction for 3–4 weeks. Control group was cultured for the same time in complete medium and stained with Oil red; (D) Chondrogenic induction of SHED. Alcian staining of SHED were applied after chondrogenic induction for 3–4 weeks. Control group was cultured for the same time in complete medium and stained with Alcian; (E) Neural induction of SHED. After SHED were induced in neural differentiation medium (EGF/FGF/NGF/GDNF, 10mg/ml respectively) for 10 days, the neural stem cell marker nestin was detected. The antibody of nestin produces green fluorescence while DAPI binds to the nucleus and produces blue fluorescence; (F) Transmission Electron Microscope of SHED. SHED were made into cell suspension and the SEM picture showed the morphology, size and distribution of the cells; (G) Cell proliferation curve of SHED. After SHED were seeded into the plate, the absorbance is measured once a day, and the cell viability is [A(Dn)-A(blank)] / [A(D1)-A(blank)] × 100%. “A” represent the absorbance, “Dn” represents the Nth day, n = 1, 2, 3, 4, 5, 6, 7.

