Figure 2.

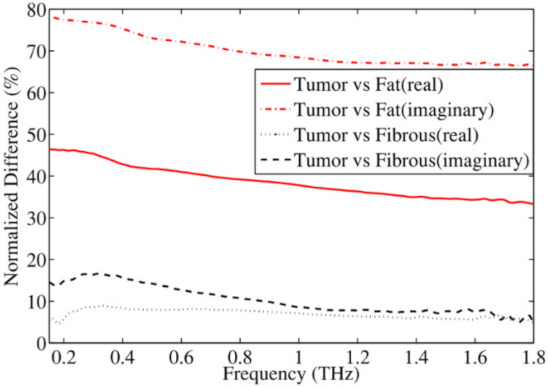
Normalized percentage difference in the average complex permittivity between two breast tissue groups (fibrous and fat) and tumor [57].

Normalized percentage difference in the average complex permittivity between two breast tissue groups (fibrous and fat) and tumor [57].