Figure 10.

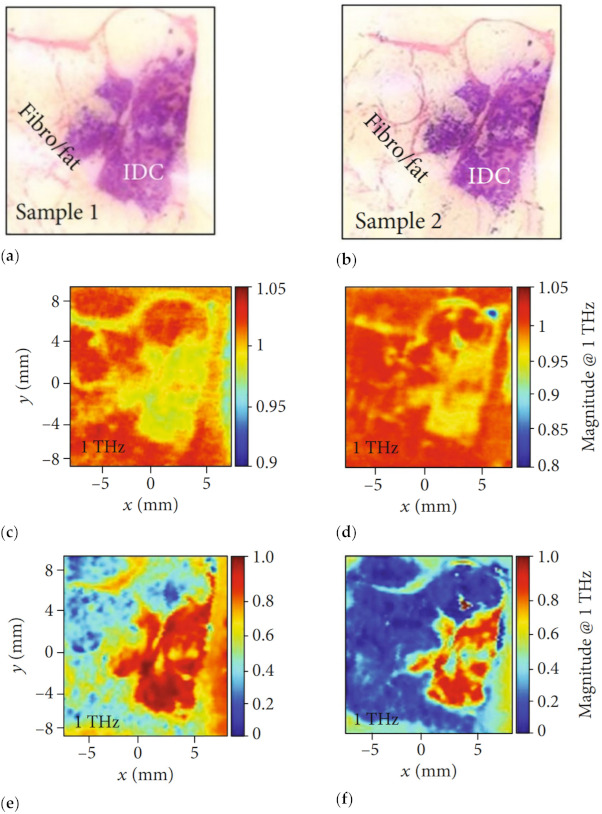
Images of IDC. Pathology of (a) sample 1 and (b) sample 2. Transmission magnitude images at 1 THz of (c) sample 1 and (d) sample 2. Reflection magnitude images at 1 THz of (e) sample 1 and (f) sample 2 [34].

Images of IDC. Pathology of (a) sample 1 and (b) sample 2. Transmission magnitude images at 1 THz of (c) sample 1 and (d) sample 2. Reflection magnitude images at 1 THz of (e) sample 1 and (f) sample 2 [34].