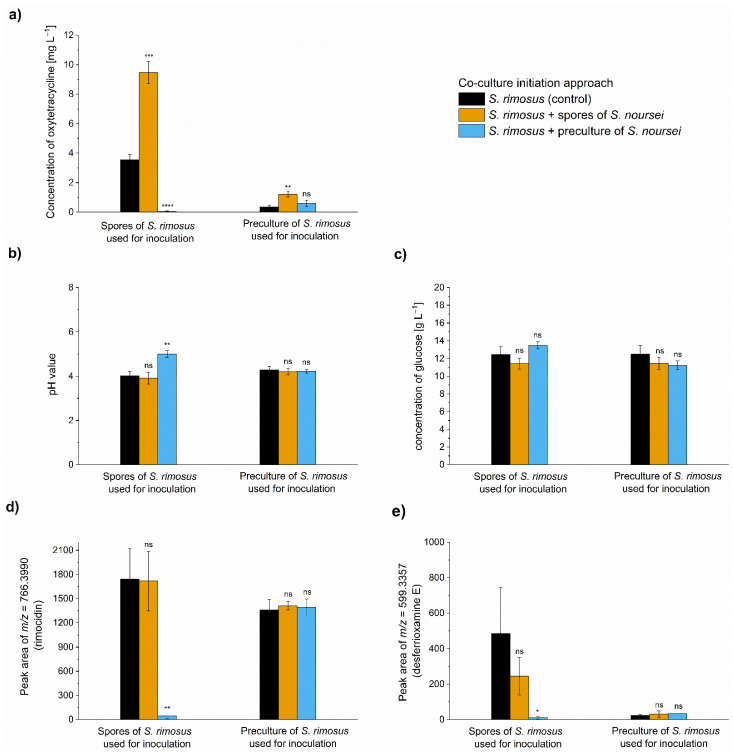
Figure 2.
The values of oxytetracycline concentration (a), pH (b), glucose concentration (c), peak area corresponding to rimocidin (d) and desferrioxamine E (e) after 60 h of submerged co-cultivation of S. rimosus with S. noursei in shake flasks. Several inoculation approaches were tested. The results are given as mean ± SD from three independent experiments (n = 3). The two-sample t-test was performed to indicate whether the results obtained for the co-cultures differed significantly from the ones recorded for the S. rimosus monoculture controls. * p ≤ 0.05, ** p ≤ 0.01, *** p ≤ 0.001, **** p ≤ 0.0001, n—not significant. The peak areas are given in auxiliary units.

