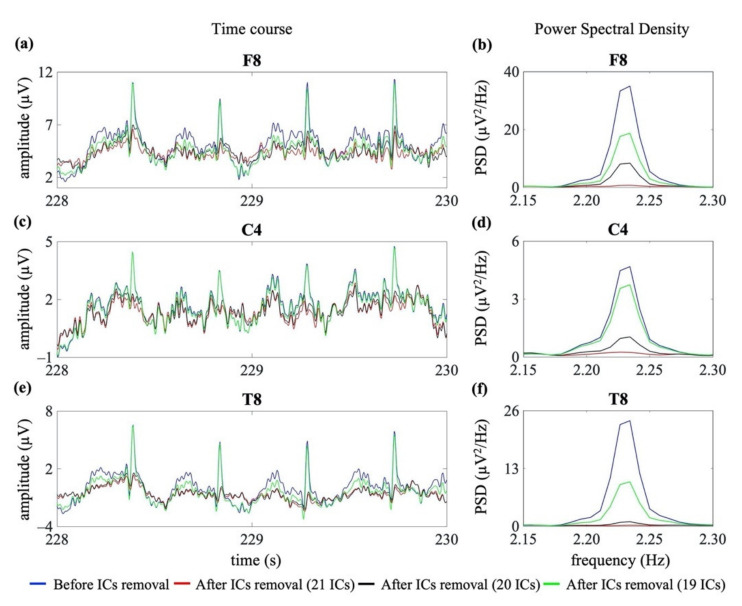
Figure 6.
Examples of cardiac artefact removal in three EEG channels (frontal: F8, central: C4 and temporal: T8). Panels (a,c,e) show 2 s of the time course of three exemplary EEG signals from one neonatal EEG segment. Panels (b,d,f) show the PSD around the specific heart rate frequency (i.e., 2.23 Hz). The blue lines indicate the PSD and time course before the removal of cardiac-related interference. The red, black and green lines indicate the PSD and time course after removal of the cardiac-related interference using the three signal groups, i.e., decomposing to 21 ICs, 20 ICs and 19 ICs.

