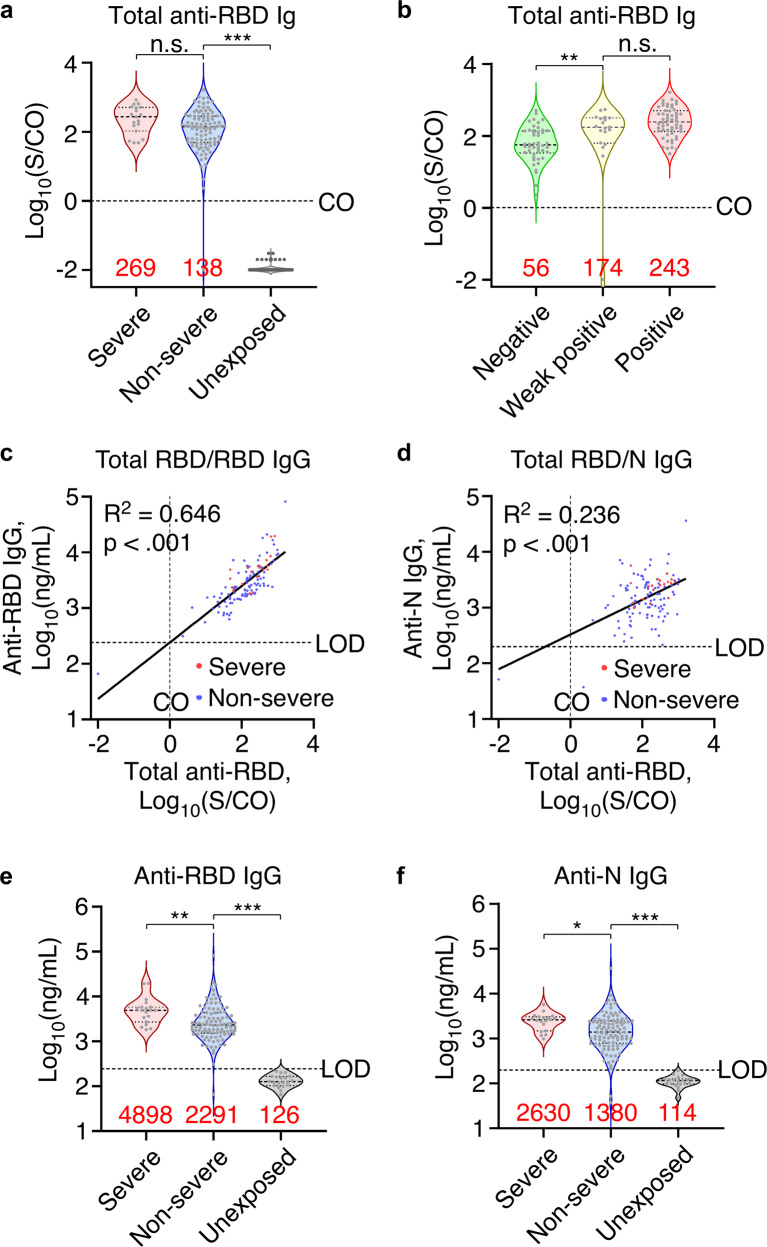
Fig. 1.
Long-lasting SARS-CoV-2 antibody response 1-year after infection. a Total anti-RBD antibodies in non-severe (n = 102) and severe patients (n = 19) sera 10–12 months after infection and in unexposed population (n = 100) measured by CMIA. CO, cutoff value. b Total anti-RBD antibodies in sera of participants with SARS-CoV-2 GICA negative (n = 46), weak positive (n = 19), or positive (n = 56) results. c, d Scatter plot showing linearity of total anti-RBD antibodies with anti-RBD IgG (c) or anti-N IgG (d). Linear regression was performed on all datapoints. n = 121. e, f Anti-RBD (e) and anti-N IgG (f) concentrations in non-severe (n = 102) and severe patients (n = 19) 10–12 months after infection and in unexposed population (n = 20) measured by ELISA. Red numbers indicate median value for violin plots. Dotted lines indicate the diagnostic cut-off (CO) for total anti-RBD antibody titers or the limit of detection (LOD) for anti-RBD or anti-N IgG concentrations. *p < .05, **p < .01, ***p < .001, n.s. not significant

