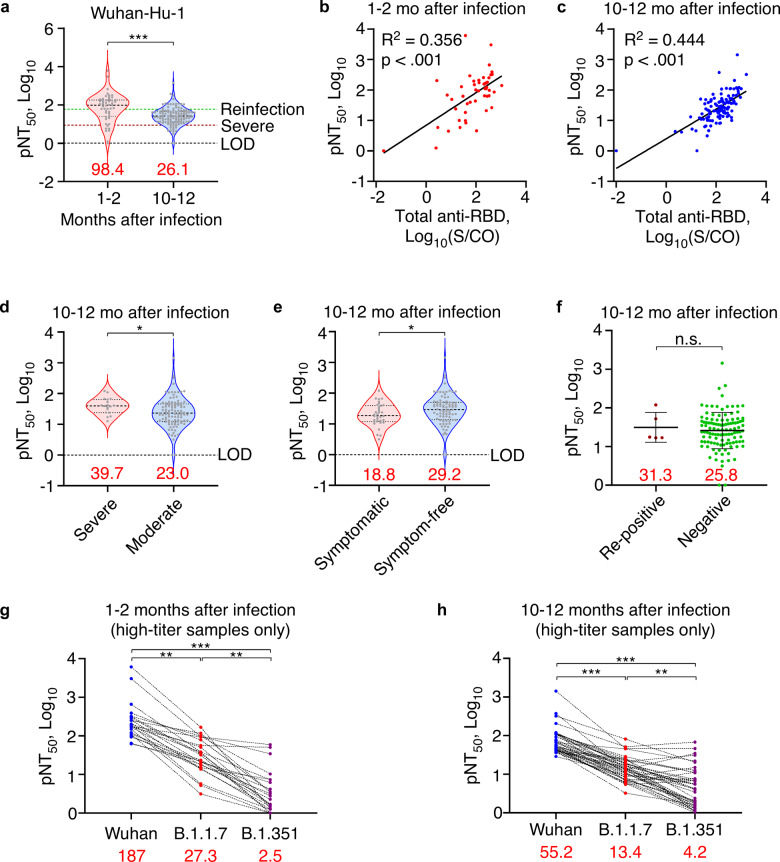
Fig. 3.
Time- and variant-dependent reduction of serum neutralization levels. a Neutralization levels of 1–2-month post-infection (n = 50) and 10–12-month post-infection sera (n = 119) against Wuhan-Hu-1 pseudovirus measured by PNA. Green and crimson dotted lines indicate 50% protective threshold against detectable and severe re-infection, respectively. b, c Scatter plot showing linearity of neutralization titers against Wuhan-Hu-1 pseudovirus with total anti-RBD antibodies in 1–2-month post-infection (n = 50) (b) or 10–12-month post-infection sera (n = 119) (c). Linear regression was performed on all datapoints after log-transformation. d Neutralization levels of 10–12-month post-infection sera against Wuhan-Hu-1 pseudovirus among severe (n = 18) and moderate COVID-19 survivors (n = 101). e Neutralization levels of 10–12-month post-infection sera against Wuhan-Hu-1 pseudovirus among symptomatic (n = 34) and symptom-free COVID-19 survivors (n = 85). f Neutralization levels of 10–12-month post-infection sera against Wuhan-Hu-1 pseudovirus among viral RNA re-positive (n = 5) and consistently negative COVID-19 survivors (n = 114). Bar = mean ± SD. g, h Before-after plots of neutralization levels against Wuhan-Hu-1, B.1.1.7 or B.1.351 pseudovirus in 1–2-month post-infection (n = 24) (g) or 10–12-month post-infection sera (n = 42) (h). Data were analyzed by Friedman test with post hoc comparisons. Red numbers indicate median value for violin plots or mean value for scatter plots. Dotted lines indicate the diagnostic cut-off (CO) for total anti-RBD antibody titers or the limit of detection (LOD) for neutralization assays. *p < .05, **p < .01, ***p < .001, n.s. not significant

