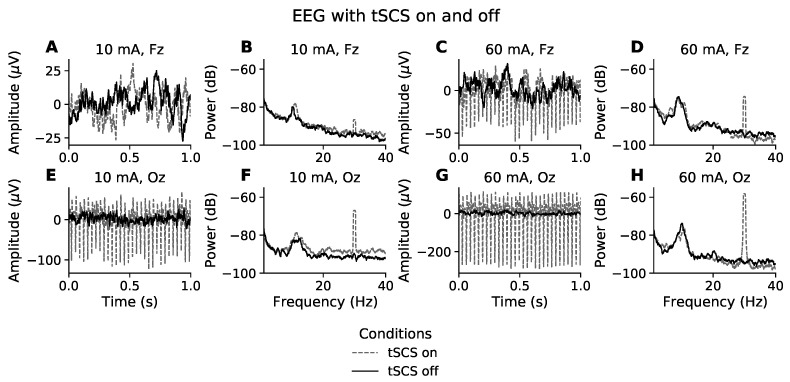
Figure 1.
Effect of tSCS on EEG in the time and frequency domain. Time domain (A,C,E,G): The first and third column show one second of resting state, eyes closed EEG for the participants with the lowest (10 mA) and highest (60 mA) tolerance to stimulation intensity, respectively. The EEG channel farthest from the stimulation site (Fz) is represented in the first row while the second row relates to the channel most proximal to the stimulation site (Oz). Frequency domain (B,D,F,H): The second and fourth column show the power spectral density of resting state, eyes closed EEG for the participants with the lowest (10 mA) and highest (60 mA) tolerance to stimulation intensity, respectively. EEG with stimulation on and stimulation off are presented with grey dashed and solid black lines, respectively.

