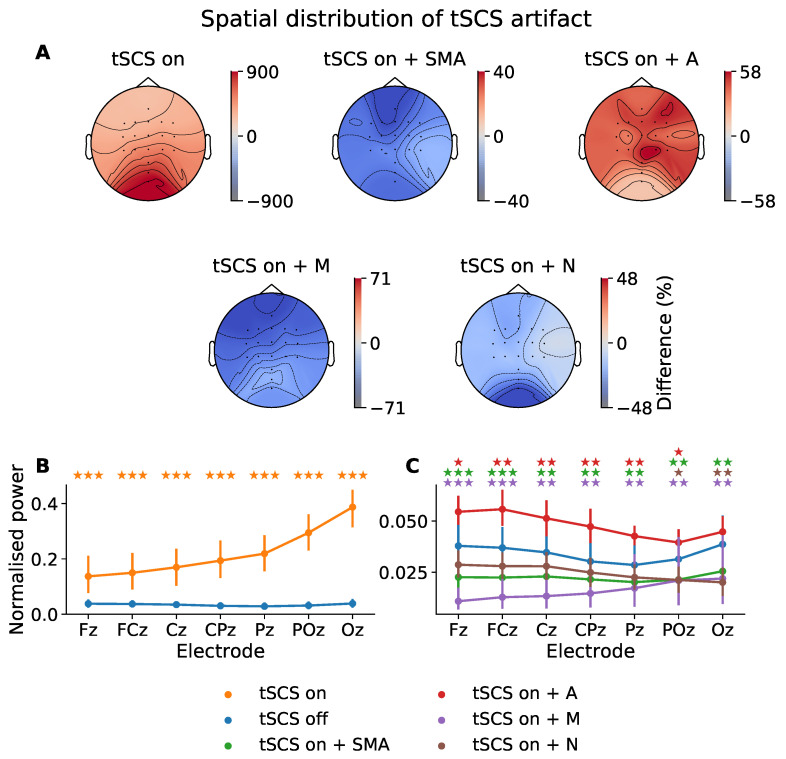
Figure 3.
Power distribution at 30 Hz (i.e., the stimulation frequency) across all participants. (A) Topographic power differences of tSCS-on, and its filtered derivatives, relative to tSCS-off (%). SMA: superposition of moving averages filter; A: adaptive filter; M: Median filter; N: notch filter. (B) Normalised spectral power at 30 Hz across midline electrodes during tSCS-on and tSCS-off. (C) Normalised spectral power at 30 Hz across midline electrodes for tSCS-off and tSCS-on after artifact-suppression. The p-values from a Wilcoxon signed-rank test between tSCS-off and each tSCS-on condition are indicated with a colour-coded star for each electrode (★ p < 0.05, p < 0.01, p < 0.001).

