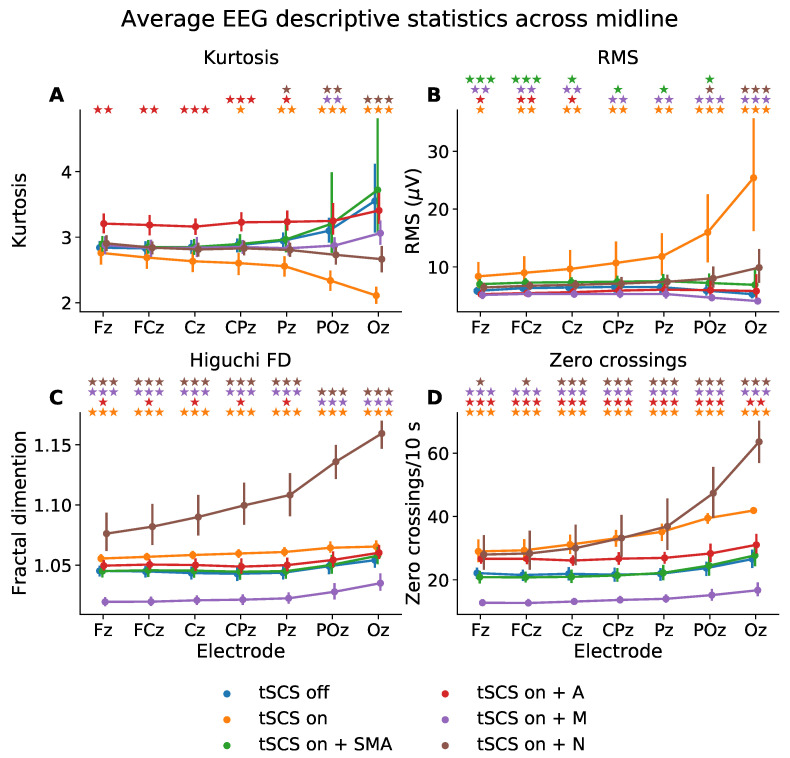
Figure 4.
Mean descriptive statistics—(A) kurtosis, (B) root mean square (RMS), (C) Higuchi fractal dimension (FD), (D) zero-crossings—of eyes closed, resting state EEG from midline electrodes, for tSCS-off, tSCS-on, and tSCS-on with filtering. SMA: superposition of moving average filter; A: adaptive filter; M: median filter; N: notch filter. The p-values from a Wilcoxon signed-rank test between tSCS-off and each tSCS-on condition are indicated with a colour-coded star for each electrode (★ p < 0.05, p < 0.01, p < 0.001).

