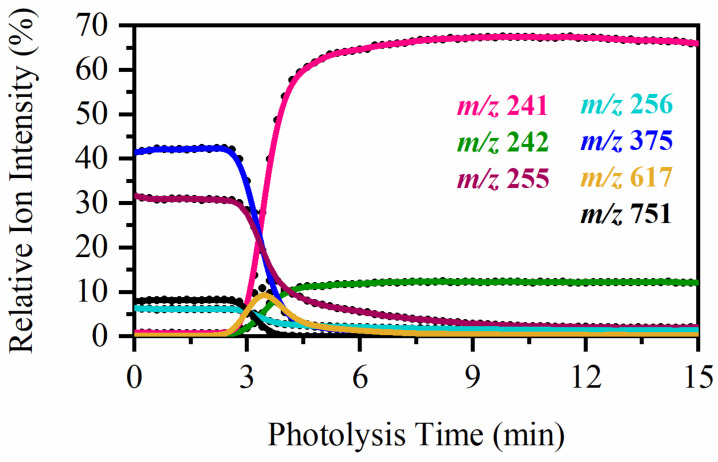
Figure 9.
Relative ion intensity plot highlighting the solution-phase photofragment ions of aqueous [RF − H]− produced over a 15 min interval of irradiation at 365 nm (3.4 eV) when delivered via ESI-MS in the negative ion mode. The curved lines included with the data points are a three-point adjacent average of such data points and are extracted from an average of 3 repeat runs. The production curves of the minor solution-phase photofragments are illustrated in Figure S4.

