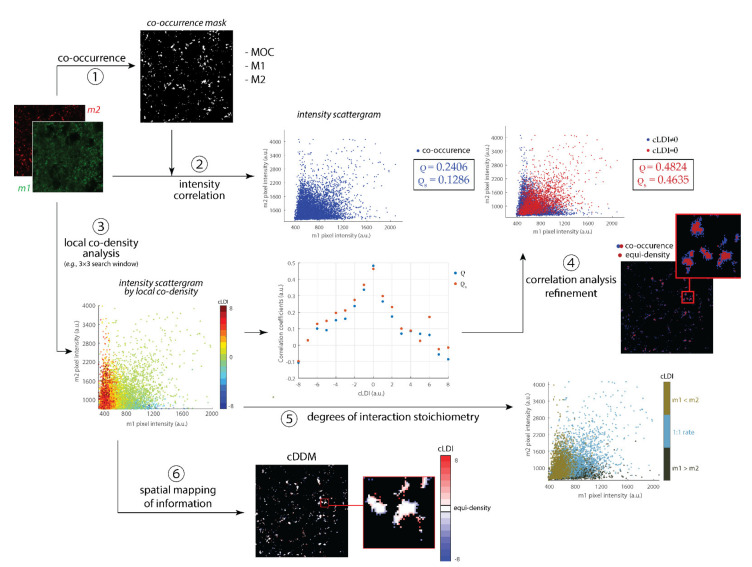
Figure 2.
Functional implications of coDDM. Starting from a couple of marked images (m1 and m2), colocalization is usually quantified as a combination of markers overlap (by co-occurrence mask and Manders’ MOC, M1 and M2 coefficients computation, ①) and intensity correlation (primarily by ρ and ρs correlation coefficients, ②). By cLDIs computation, co-occurrence pixels can be further partitioned by their local co-density and resulting groups visualized in a pseudo-color scattergram (③). When quantifying colocalization through markers’ intensity correlation, the analysis specificity can be increased by narrowing the computational domain from the co-occurrence to the equi-density region (i.e., made of pixels with cLDI = 0, ④). In addition, being based on density instead of intensity, cLDIs are more appropriate for estimating markers’ relative abundance (⑤). Finally, cDDM permits to preserve the spatiality of original images, additionally coding it with colors for the regional investigation of cLDI distribution (⑥). Details of presented scatterplot data in Supplementary Figure S1A–C.

