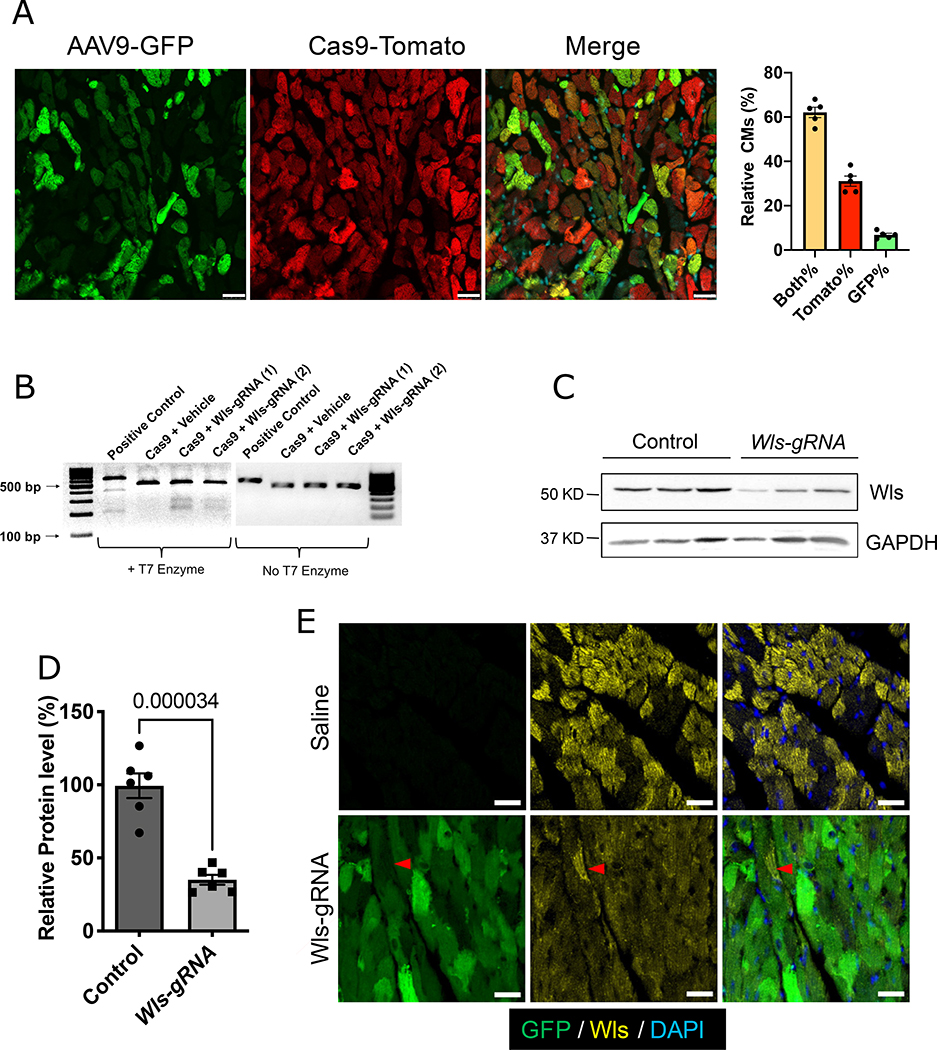
Figure 3. Deletion of Wls in CMs by CRISPR/Cas9.
A, Endogenous GFP (green, reporter of AAV9 infection) and tdTomato (red, reporter of Cas9) expression in CM-Cas9 mice 10 weeks after AAV9-Wls-gRNA injection. Scale bars=25 μm. Bar graph shows the percentages of CMs with both tdTomato and GFP (Both%), tdTomato only (Tomato%), and GFP only expression (GFP%). B, T7 surveyor assay of isolated CMs. Cleaved bands indicate genome editing in exon 2 of Wls. (1) and (2) indicate samples from 2 different mice. C, Western blotting to detect Wls protein in isolated CMs. Quantification of Western blotting is shown in (D) (n=6). Protein expression levels are relative to the GAPDH; the average value of the control group was set to 1. Error bars represent ± standard error of the mean. Mann-Whitney test was used for the comparison. Saline-injected wild-type littermates were used as controls. E, Immunofluorescence staining for Wls (yellow) in Wls-KD mice or saline-injected wild-type mice. Green (GFP), Wls-gRNA. White dashed line indicates uninfected cells that retain Wls expression. Saline indicates saline-injected wild-type littermates. Scale bars=25 μm.

