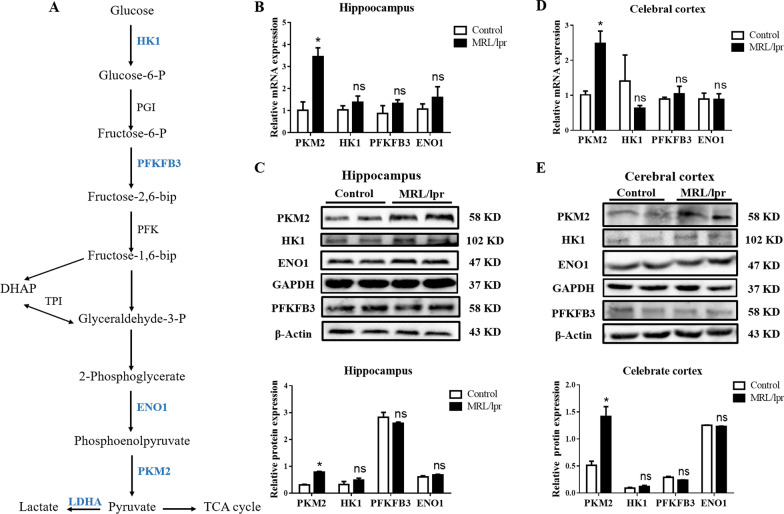
Fig. 3.
Glycolytic enzyme PKM2 is upregulated in NPSLE mice. A The simplified scheme indicating the main metabolic routes followed by glucose, the key intermediates and enzymes involved, and the enzymes studied in the text are highlighted for simplicity. Dashed arrows indicate downstream intermediates or metabolic pathways. B The mRNA expression of PKM2, HK1, PFKFB3, and ENO1 in the hippocampus of control and MLR/lpr groups, n = 6. C Western blot quantification of PKM2, HK1, PFKFB3, and ENO1 proteins in the hippocampus of control and MLR/lpr groups, n = 4. D The mRNA expression of PKM2, HK1, PFKFB3, and ENO1 in the cerebral cortex of control and MLR/lpr groups, n = 6. E Western blot quantification of PKM2, HK1, PFKFB3, and ENO1 in the cerebral cortex of control and MLR/lpr groups, n = 4. Data are presented as mean scores ± SEM, *P ≤ 0.05

