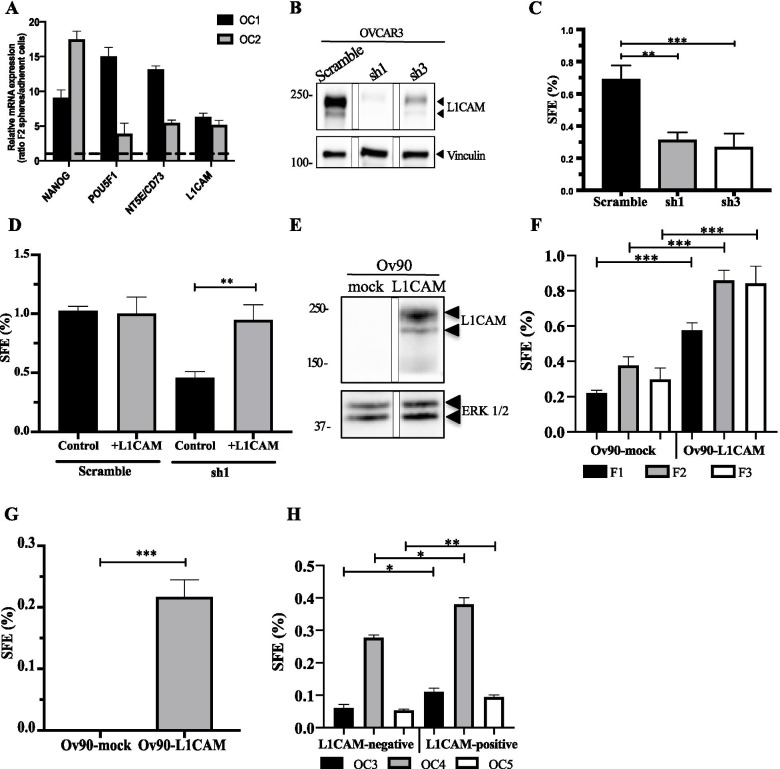
Fig. 1.
Expression and genetic manipulation of L1CAM in OCSC. (A) qRT-PCR for L1CAM and the stemness-related genes NANOG, POU5F1 and NT5E on second-generation spheres from OC primary cells. Data are expressed as relative mRNA level (2-ΔΔCt) and normalized to the corresponding adherent cultures (dashed line). Data refer to two independent primary OC samples (OC1 and OC2). (B) Immunoblotting on L1CAM-silenced OVCAR3 cells. L1CAM silencing was efficiently achieved through two different shRNAs. Vinculin served as loading control. The panel shows a single blot, intervening lanes were removed for clarity reasons. (C) Sphere forming efficiency (SFE) on L1CAM-knockdown and control OVCAR3 cells. (D) Sphere formation assay conducted on L1CAM-knockdown or control OVCAR3 cells upon rescuing L1CAM expression. (E) Immunoblot for L1CAM in L1CAM- and mock-transduced Ov90 cells. ERK1/2 served as loading control. The panel shows a single blot, intervening lanes were removed for clarity reasons. (F) L1CAM-trasduced Ov90cells were subjected to sphere formation assay for three consecutive sphere generations. (G) Sphere formation assay conducted in medium depleted of both EGF and FGF2. (H) Three different primary ovarian cancer samples (OC3, OC4 and OC5) were sorted according to L1CAM expression (see Supplementary Fig. S4) and subjected to sphere formation assay. For each analysis, data are expressed as means ± SEM from three independent experiments. Comparisons between experimental groups were done with two-sided Student’s t-tests; *p < 0.05, **p < 0.01, ***p < 0.001

