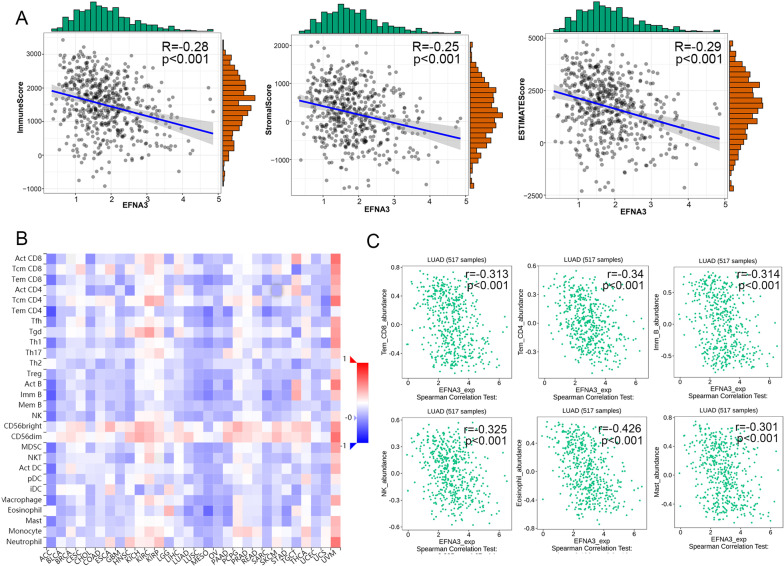
Fig. 9.
Correlation analysis between EFNA3 expression and immune infiltration. A The relationship between EFNA3 expression and immune scores, stromal scores, and ESTIMATE score; B The abundances of TILs correlated with EFNA3 expression. C Effector memory CD4 T cell (rho = − 0.34, p = 2.64e−15), effector memory CD8 T cell (rho = − 0.313, p = 4.6e−13), Immature B cell (Imm B cell) (rho = − 0.314, p = 3.58e−13), NK cell (rho = − 0.325, p = 4.67e−14), Eosinophil cell (rho = − 0.426, p = 2.2e−16), and mast cell (rho = − 0.301, p = 3.45e−12) was correlate with EFNA3 expression level in LUAD

