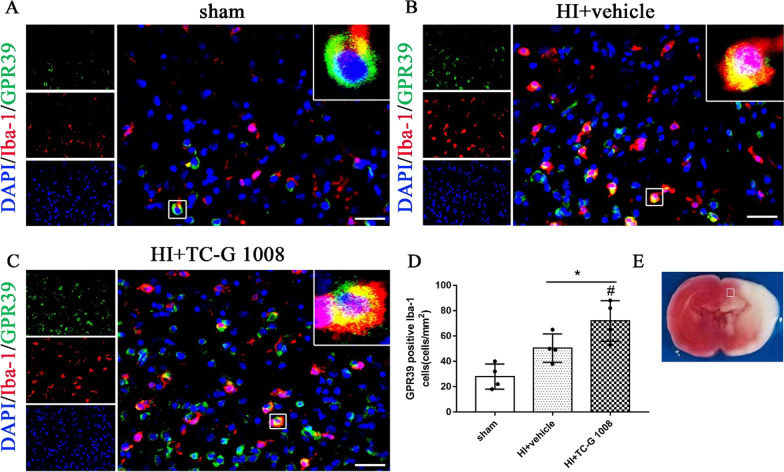
Fig. 3.
Representative immunofluorescence staining of GPR39 and the microglia marker Iba-1 in the brain at 48-h post-HIE. GPR39 was co-localized with Iba-1 in the sham (A), vehicle (B), and TC-G 1008 treatment (15 mg/kg) group (C), respectively. Compared with the sham group, GPR39 (green) expression was increased on microglia (red) in vehicle group and further increased post-TC-G 1008 treatment. Blue was for nucleus (DAPI). D Quantitative analysis of GPR39-positive Iba-1 cells in the ipsilateral cortex at 48-h post-HIE. E The schematic diagram shows the location of immunofluorescence staining (small white box). (Data are represented as mean ± SD; *p < 0.05 vs. sham; #p < 0.05 vs. HIE + vehicle; n = 4/group; scale bar = 50 μm)

