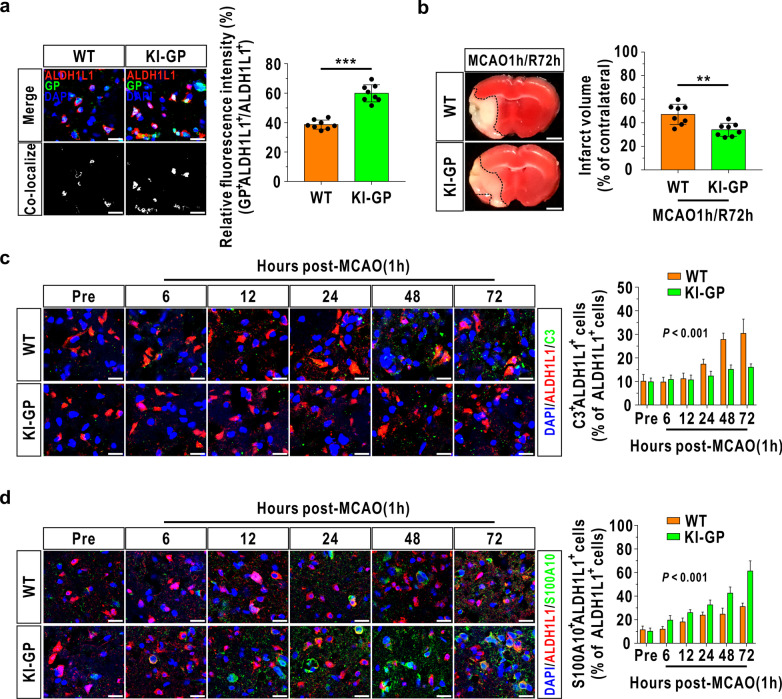
Fig. 1.
Glycogen mobilization suppresses A1-like astrocyte formation and accelerates A2-like astrocyte formation during MCAO/R. a Verification of successful generation of astrocyte-specific GP overexpression mice (KI-GP). Left panels: Representative images using immunofluorescence staining with antibodies against ALDH1L1 and GP in frontal cortex area 1 of the KI-GP mouse brain. The scale bars represent 20 μm. Right panels: Quantitative analysis of the relative fluorescence intensity of GP (n = 8). The relative fluorescence intensity was calculated by dividing the fluorescence intensity in the colocalization area by the fluorescence intensity in the ALDH1L1+ area. Astrocytes were marked with ALDH1L1. WT represents wild-type animals. b Left panel: Representative TTC-stained brain slices at 72 h following MCAO/R. The scale bars are 1 mm. Right panel: Quantitative analysis of the infarct volume in the left panel (n = 8). c Left panel: Coronal images of the cerebral ischemic penumbra following immunofluorescence analysis with antibodies against ALDH1L1 and C3 before (Pre) and after MCAO/R injury. The scale bars represent 20 μm. Right panel: Percentage of C3+ALDH1L1+ cells relative to ALDH1L1+ cells in the left panel (n = 8). d Left panel: Coronal images of the cerebral ischemic penumbra following immunofluorescence analysis with antibodies against ALDH1L1 and S100A10 before and after MCAO/R injury. The scale bars represent 20 μm. Right panel: Percentage of S100A10+ALDH1L1+ cells relative to ALDH1L1+ cells in the left panel (n = 8). **P < 0.01, ***P < 0.001. Independent t test for a, b. Two-way ANOVA for c, d

