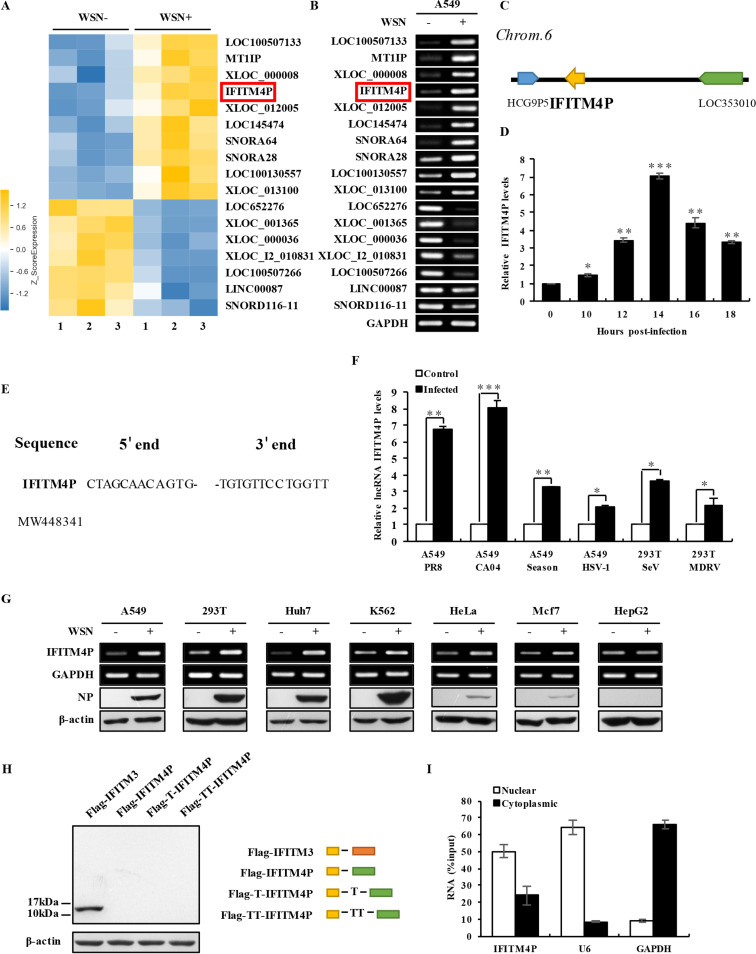
FIG 1.
Transcript of IFITM4P is identified as an lncRNA that can be induced by multiple viruses. (A) The differentially expressed lncRNAs in A549 cells infected or not infected with A/WSN/33 influenza virus were analyzed by using a cDNA microarray. Cells infected with WSN were collected at 12 h postinfection. Shown are representative lncRNAs whose expressions significantly changed after viral infection. IFITM4P is indicated in a red rectangle. (B) RT-PCR was performed to determine the expression of 17 lncRNAs in A549 cells infected or not infected with WSN (MOI of 0.5) for 14 h. IFITM4P is indicated in a red rectangle. (C) Shown is a paradigm of the genomic location of IFITM4P. (D) qRT-PCR was employed to detect RNA levels of IFITM4P in A549 cells infected with WSN (MOI of 0.5) for the indicated times. Data represent mean values ± SEM (n = 3; *, P < 0.05; **, P < 0.01; ***, P < 0.001). (E) 5′ and 3′ RACE analyses were performed. Shown are the 5′ end and 3′ end sequences of IFITM4P. (F) qRT-PCR was employed to detect the RNA levels of IFITM4P in A549 cells infected with A/Puerto Rico/8/1934 (PR8), A/California/04/2009 (CA04), A/Shanghai-Jiading/SWL1970/2015 (Season) or herpes simplex virus 1 (HSV-1), and in 293T cells infected with Sendai virus (SeV) or Muscovy duck reovirus (MDRV). Data represent mean values ± SEM (n = 3; *, P < 0.05; **, P < 0.01; ***, P < 0.001). (G) Human cell lines, including A549, 293T, Huh7, K562, HeLa, MCF7, and HepG2, were infected or not infected with WSN (MOI of 0.5) for 14 h. Expression of IFITM4P and IAV nucleoprotein (NP) in these cell lines was assessed by RT-PCR and Western blotting, respectively. (H) The full length of IFITM4P was cloned into pNL vector with an N-terminal Flag tag in three reading frames. Flag-IFITM3 served as the positive control. Yellow, orange, and green rectangles indicate Flag tag, IFITM3, and IFITM4P, respectively. Plasmids were transfected into 293T cells for 48 h, and cell lysates were subjected to Western blotting with anti-Flag antibody. (I) The RNA levels of IFITM4P in cytoplasmic and nuclear fractions from A549 cells were examined by qRT-PCR. U6, GAPDH, and total RNA levels served as the nuclear, cytoplasmic, and input RNA controls, respectively. Data are shown as percentage of input. Data represent mean values ± SEM. Shown are representatives from three independent experiments.

