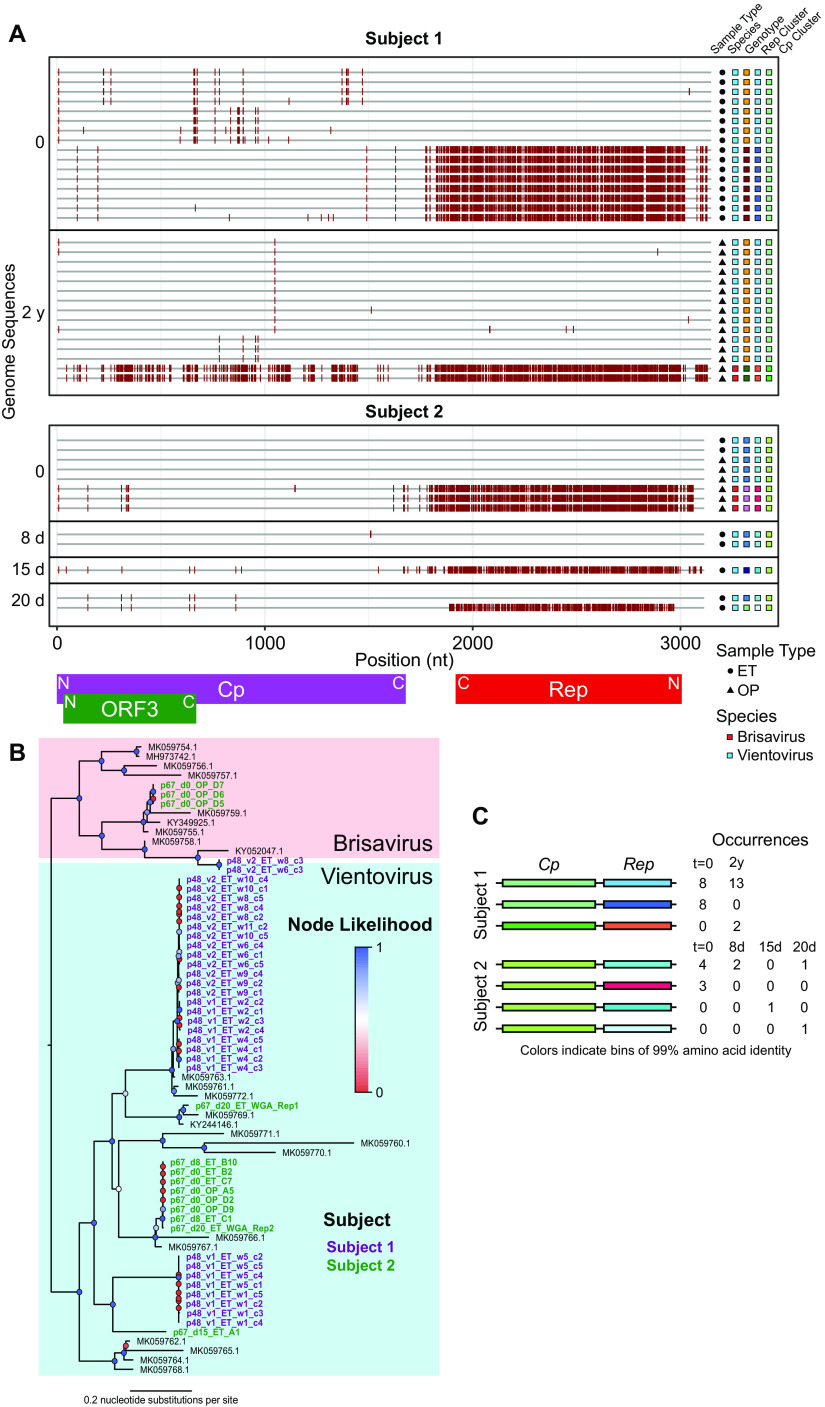
FIG 2.
Longitudinal analysis of within-subject redondovirus diversity. (A) Highlighter plot of redondovirus genome nucleotide sequences from each subject analyzed after limiting-dilution SGS. The x axis represents the genomic position in a multiple-sequence alignment. Each gray horizontal line represents a sequenced redondoviral genome. Sequences are grouped by subject and then by time point, shown to the left of the plot. Nucleotide positions in each isolate that do not match the global consensus sequence are indicated by a red tick. Approximate positions of redondovirus ORFs are displayed below the plot. N, amino-terminal coding region; C, carboxyl-terminal coding region. The shapes to the right of the plot indicate the sample type: endotracheal aspirate (ET) or oropharyngeal (OP). The colored boxes indicate, from left to right, the redondovirus species to which each genome belongs, the genotype (cluster at 99% genomic nucleotide sequence identity) to which each sequence belongs, and the cluster (at 99% amino acid sequence identity) to which the Rep and Cp proteins belong. (B) Phylogenetic tree of Rep amino acid sequences from SGS redondovirus genomes sequenced from longitudinally sampled subjects, along with database sequences. Sequences from subject 1 are shown in purple, sequences from subject 3 are in green, and database sequences are in black. Colored circles at each node indicate branch likelihood as indicated by the approximate likelihood ratio test. Colored boxes delineate the two redondovirus species, Vientovirus (cyan) and Brisavirus (pink). (C) Schematic showing pairings between unique redondovirus Rep and Cp clusters. Each cluster is indicated by a different color. The table to the right of the schematic indicates the number of genomes sequenced at each time point belonging to each Cp-Rep pair.

