
Fig 2.
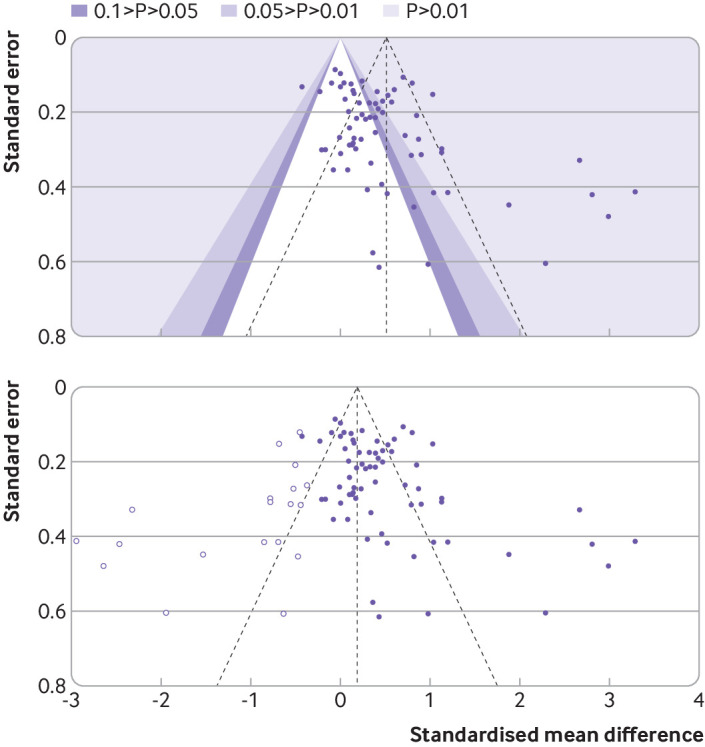
Funnel plot for formula trials with a superiority aim published between 2015 and 2020. Effect size, expressed as standardised mean difference, is shown as a purple dot for each trial primary outcome, against the corresponding standard errors. Colours indicate regions of statistical significance (top panel). Unadjusted pooled standardised mean difference is 0.51 (0.34 to 0.68), Egger’s test for funnel plot asymmetry=4.111, P<0.001. White dots represent standardised mean difference imputed with Duval and Tweedie’s trim-and-fill procedure until funnel plot symmetry is reached (bottom panel). Adjusted standardised mean difference is 0.19 (−0.03 to 0.41)