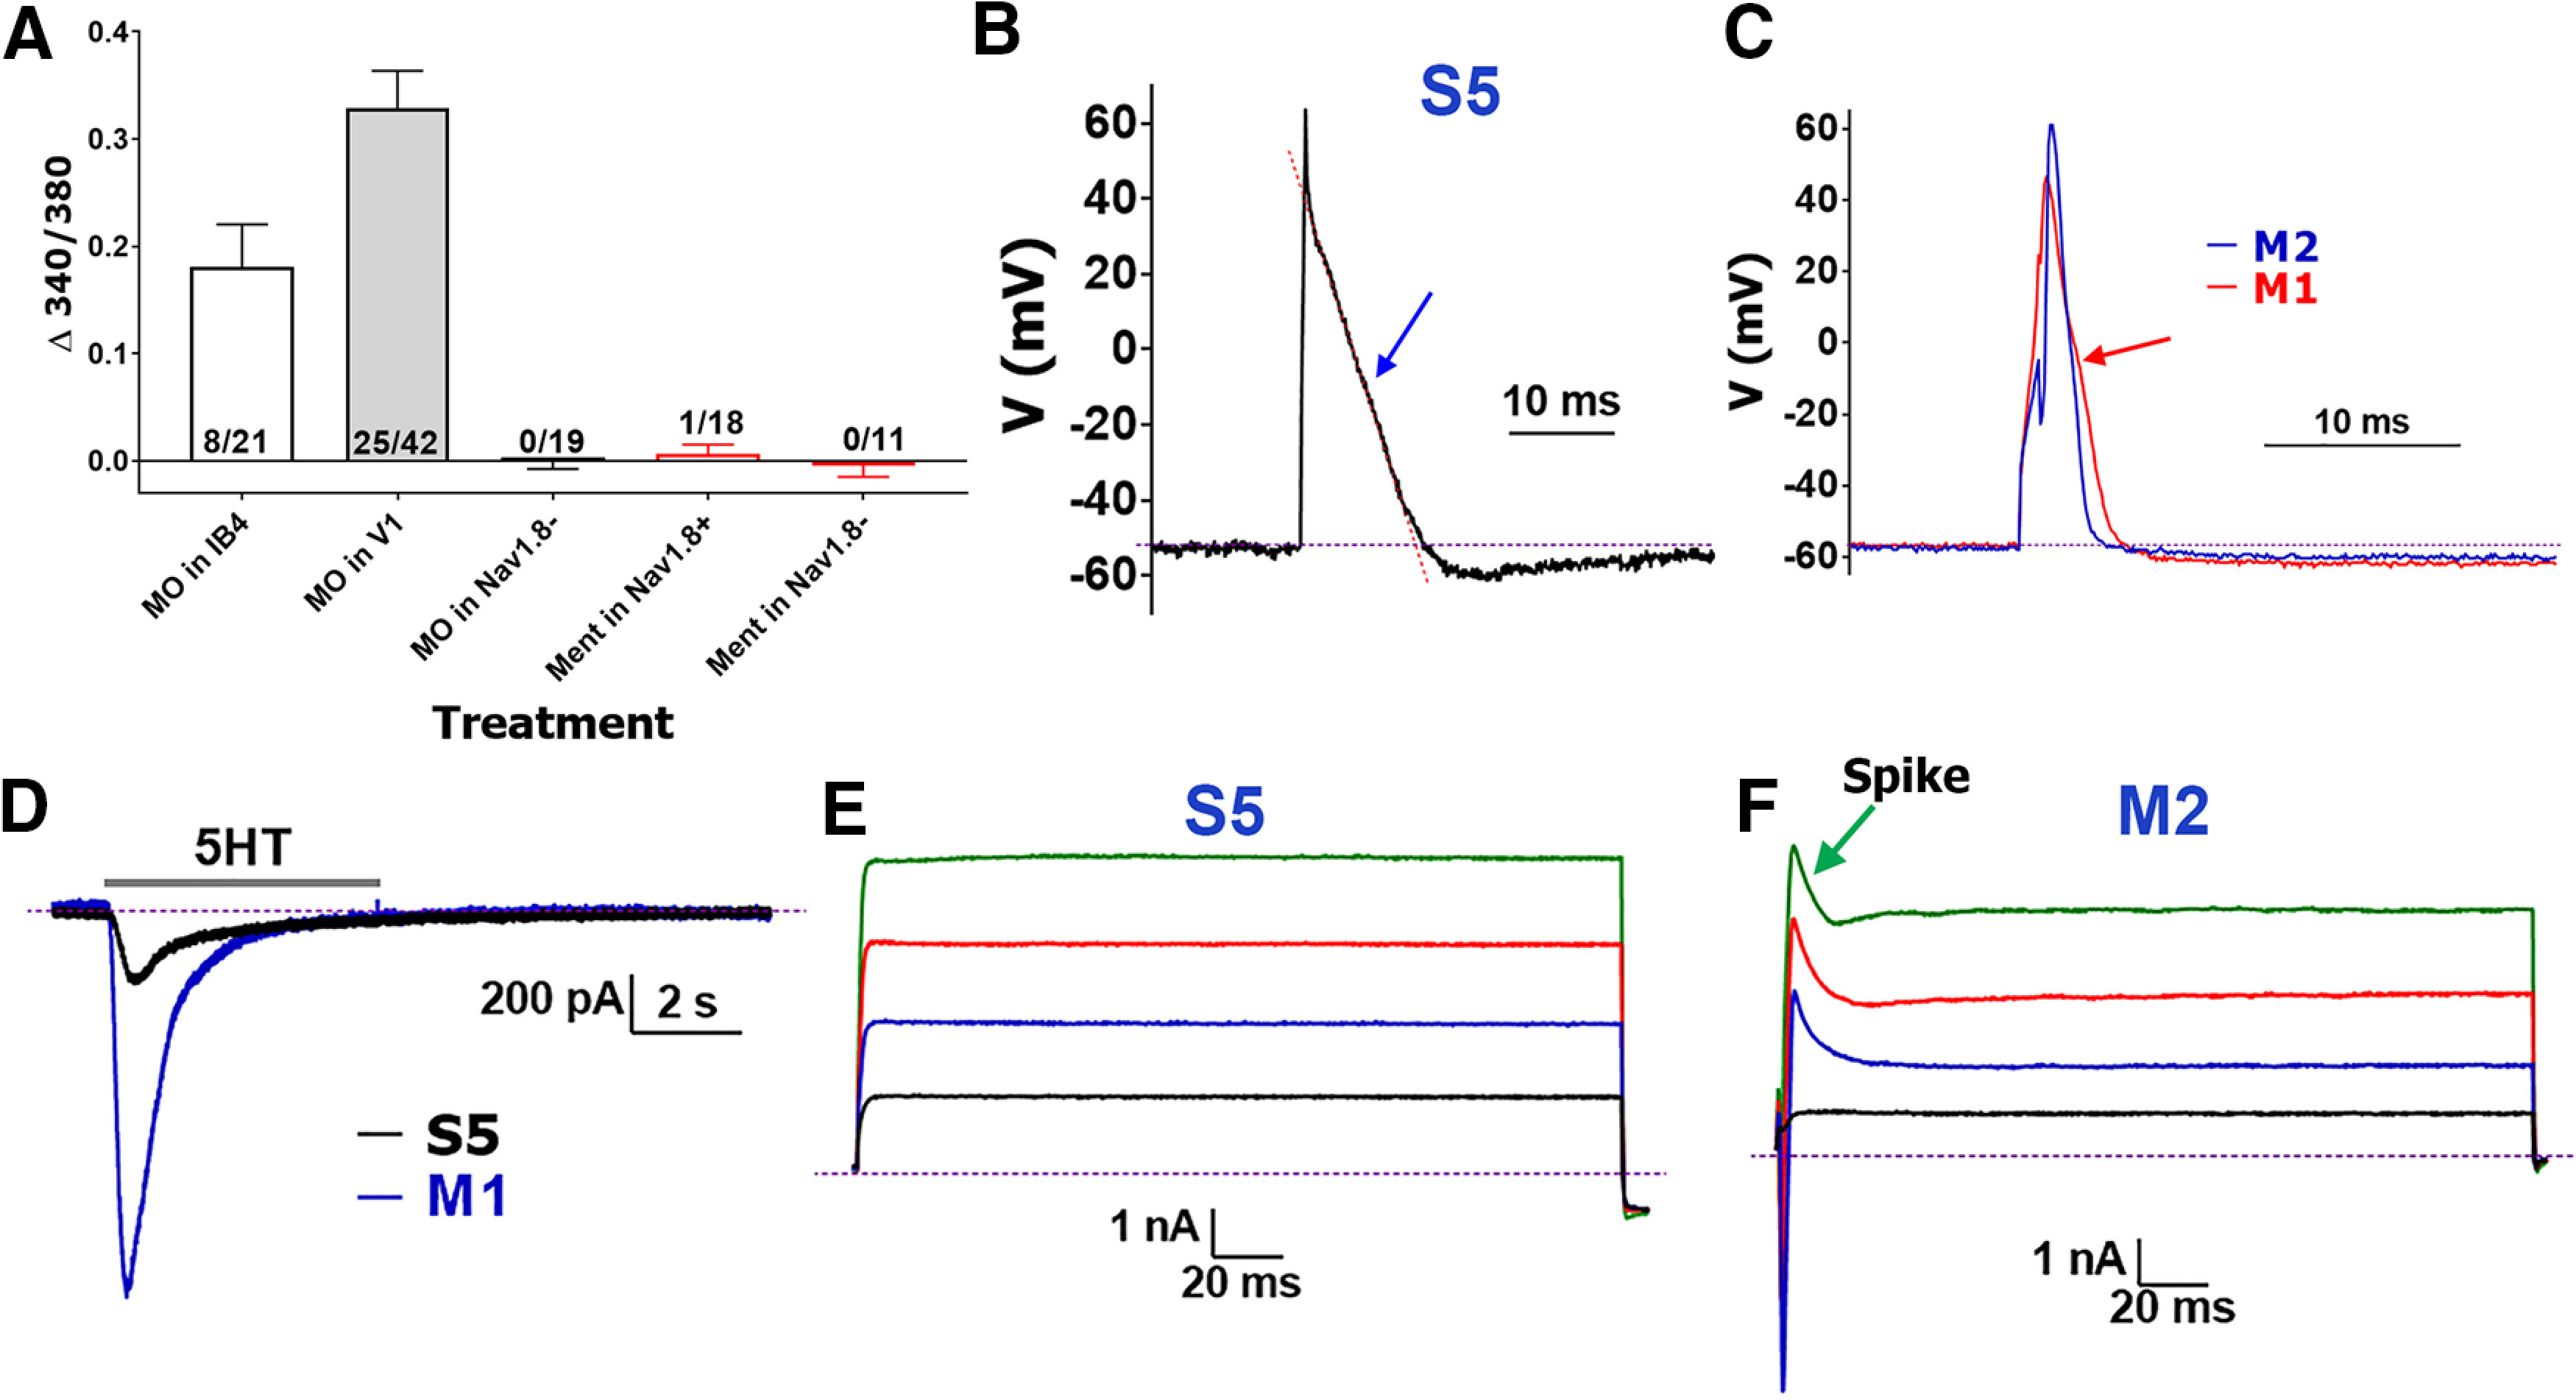
Figure 3.

Recordings from CGRP+ MM TG neurons. A, Responsiveness of IB-4+, Nav1.8+, and Nav1.8– MM TG neurons to MO (25 μm) and Ment (100 μm) measured with Ca2+ imaging. Each bar shows information on numbers of tested and responsive neurons. B, Representative AP from a MM TG CGRP+ neuron belonging to the S5 group. AP straight in S5 neurons is indicated with a blue arrow. Red dashed line demonstrates the AP shape. C, Comparison of AP shapes generated in MM TG CGRP+ neurons belonging to the M1 (red) and M2 (blue) groups. AP deflection in M1 neurons is indicated with a red arrow. M2 neuron’s AP does not display any deflection during the falling phase of AP. D, 5HT (30 μm)-induced current in MM TG CGRP+ S5 and M1 group neurons. The drug was applied for 5 s, and duration of application is indicated by a horizontal gray bar. E, Typical current (I) produced from MM TG CGRP+ neurons belonging to the S5 or M1 group. F, Typical I produced from MM TG CGRP+ M2 group neurons. Characteristic spike is indicated by green arrow. Names of neuronal groups are specified above traces. The magnitude (vertical) and time (horizontal) scale bars are presented for the B–F panels.
