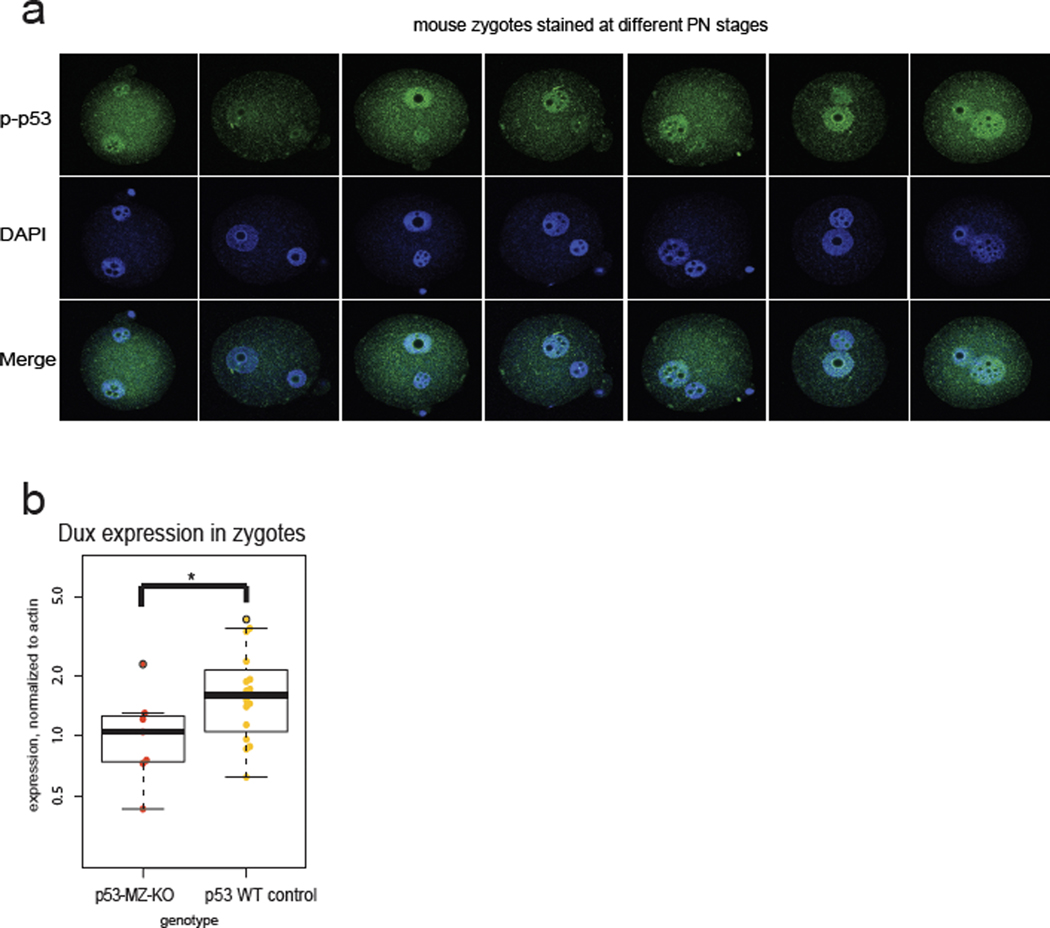
Extended Data Figure 4:
a) Immunofluorescence of pronuclei (PN)-stage zygotes showing nuclear phospho-S15 p53 staining (quantified in Fig 4A).
b) Single mouse zygote RT-qPCR measuring Dux expression in PN5 stage zygotes (n=7 p53 MZ-KO, n=16 p53 WT), * p-value <0.05, t-test.

