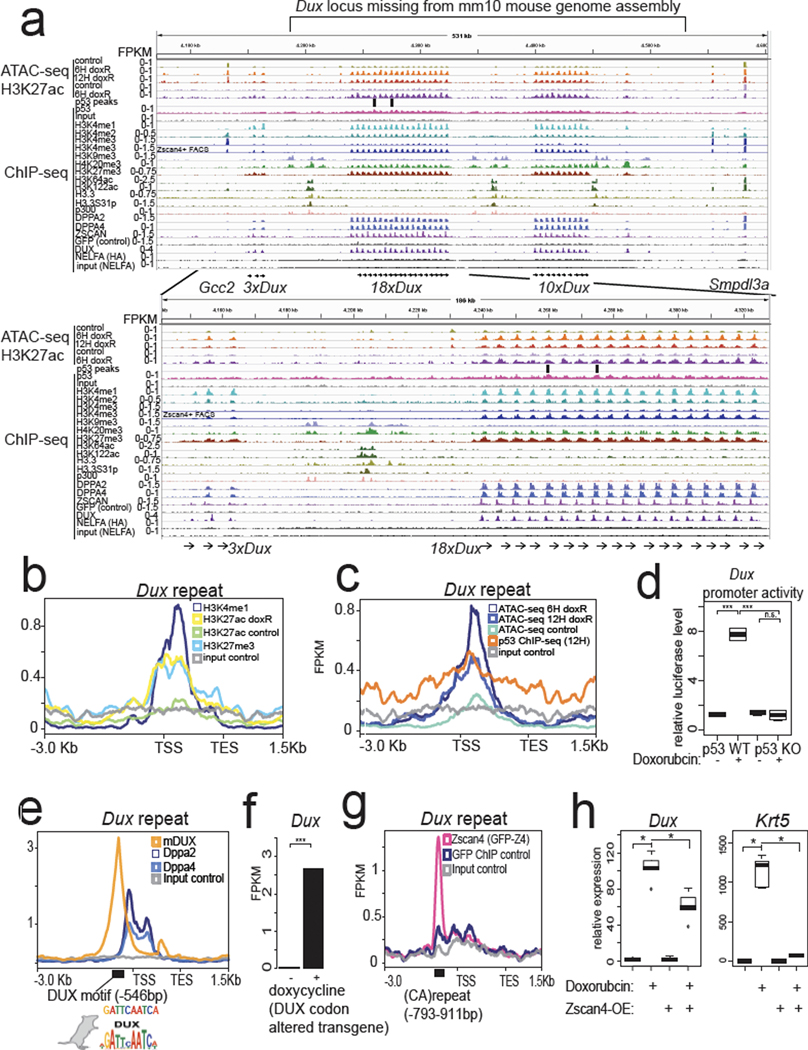
Fig. 3: Assembly of the mouse Dux locus reveals chromatin and transcriptional regulatory features.
a, Genome browser snapshots of the newly assembled PacBio-sequenced mouse Dux locus with indicated epigenomic datasets, zoom-in on 18×Dux array below (see methods for all GEO accessions). ATAC-seq = Active Transposition into Active Chromatin, ChIP-seq = chromatin immunoprecipitation followed by sequencing. b, Metagene plot of Dux repeat unit with indicated histone ChIP-seq datasets, TSS = transcription start site, TES = transcription end site. c, Metagene plot of Dux repeat unit with ATAC-seq or p53-ChIP-seq datasets. d, Luciferase assay testing a 1.3-kb fragment of the Dux promoter in WT or Trp53 KO mESCs, with vehicle treatment or doxorubicin treatment. Normalized to co-transfected Renilla luciferase. N = 4 biological replicates, *** FDR < 0.001, One-way ANOVA. e, Metagene plot of the Dux repeat showing enrichment of DPPA2/4 or DUX with the DUX TF motif shown below (Hendrickson et al. Nature Genetics, 2017). f, Doxycycline induction of codon-altered Dux transgene activates the endogenous Dux locus, RNA-seq data reprocessed from Hendrickson et al. Nature Genetics, 2017. N = 2 biological replicates, FDR < 0.01, DESeq2. g, Metagene plot of the Dux array showing enrichment of ZSCAN4 ChIP-seq signal at the (CA)repeat unit, data reprocessed from Srinivasan et al. Science Advances, 2020. h, Clonal ZSCAN4-overexpression mESCs shows lower Dux and Krt5 expression after doxorubicin treatment compared to control. N = 5 biological replicates, * FDR < 0.05, One-way ANOVA. For boxplots in Figure 3d and h, the median is shown as a line in the box, and the outline of the box is depicted at the 25th and 75th percentile. The extended whiskers depict Q1 – 1.5 × IQR and Q3 + 1.5 × IQR. Outliers points are depicted as dots.

