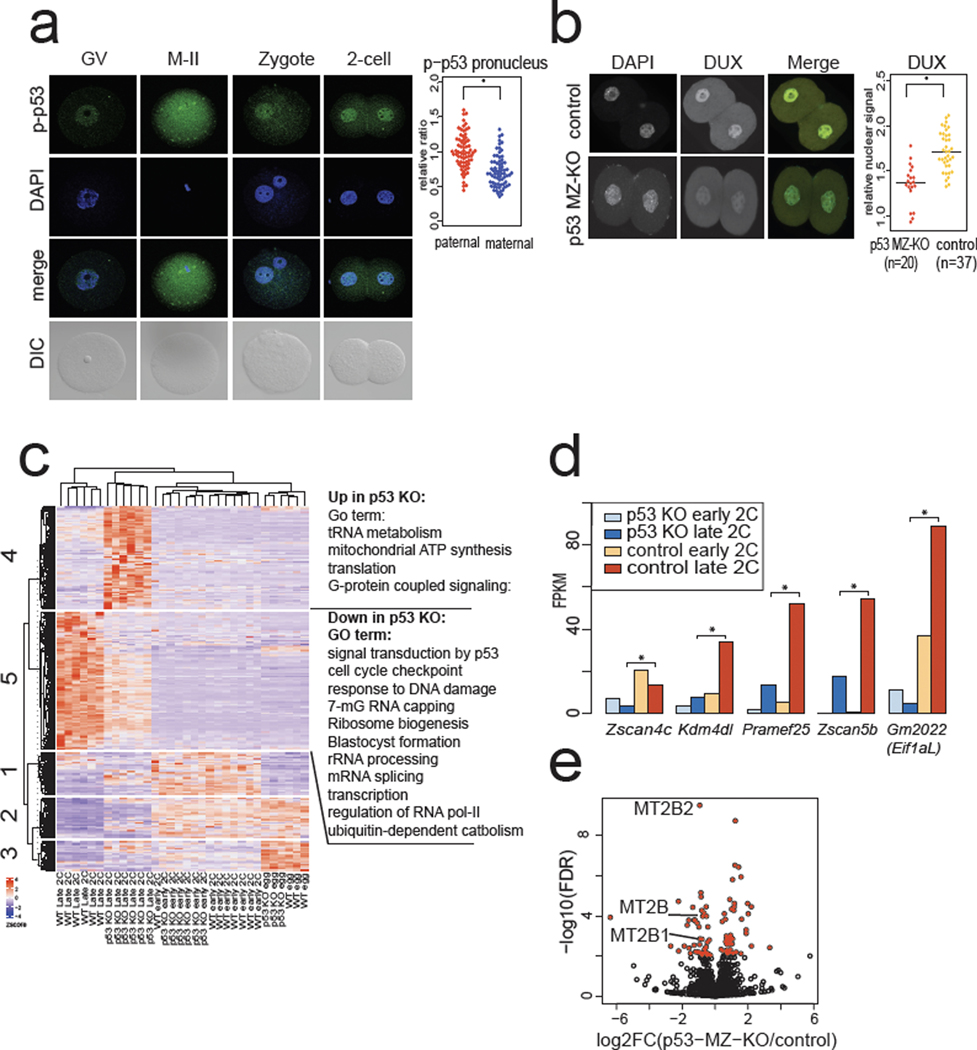
Fig. 4: p53 accumulates in mouse zygotes after fertilization and Trp53 MZ-KO embryos have lower DUX and DUX-target expression.
a, Immunostaining of mouse oocytes, eggs, and embryos using a phospho-S15 (S18 in mouse) p53 antibody. Quantification of significantly higher phospho-p53 signal in the paternal pronucleus (PN) is shown on right, n = 69 zygotes, * P < 0.05 one-sided t-test, P = 2.9 × 10⁻¹⁰. Scale bar = 40 μm. GV = germinal vesicle stage oocyte, M-II = meiosis II egg, DIC = differential interference contrast. Data combined from 3 independent experiments. Scale bar = 40 μm. b, Immunostaining of Trp53 (maternal zygotic) MZ-KO early 2-cell stage embryos with anti-DUX antibody. Merge: DAPI = cyan, DUX = yellow. Quantification is shown on right, * P < 0.05 one-sided t-test, P = 5.543 × 10⁻⁷. Scale bar = 40 μm. c, RNA-seq analysis of Trp53 MZ-KO eggs and embryos compared to WT controls. Hierarchical clustering of DESeq2 FDR < 0.01 transcripts. N = 6 embryos, n = 3 eggs per genotype per stage. d, RNA-seq from Trp53 MZ-KO embryos versus WT control embryos, Key ZGA genes shown, * FDR < 0.05 DESeq2. N = 6 embryos per genotype per stage. e, Repetitive element expression, RNA-seq from Trp53 MZ-KO embryos versus WT control embryos at late 2-cell stage, red indicates FDR < 0.05 TEtranscipts. N = 6 biological replicates per genotype.

