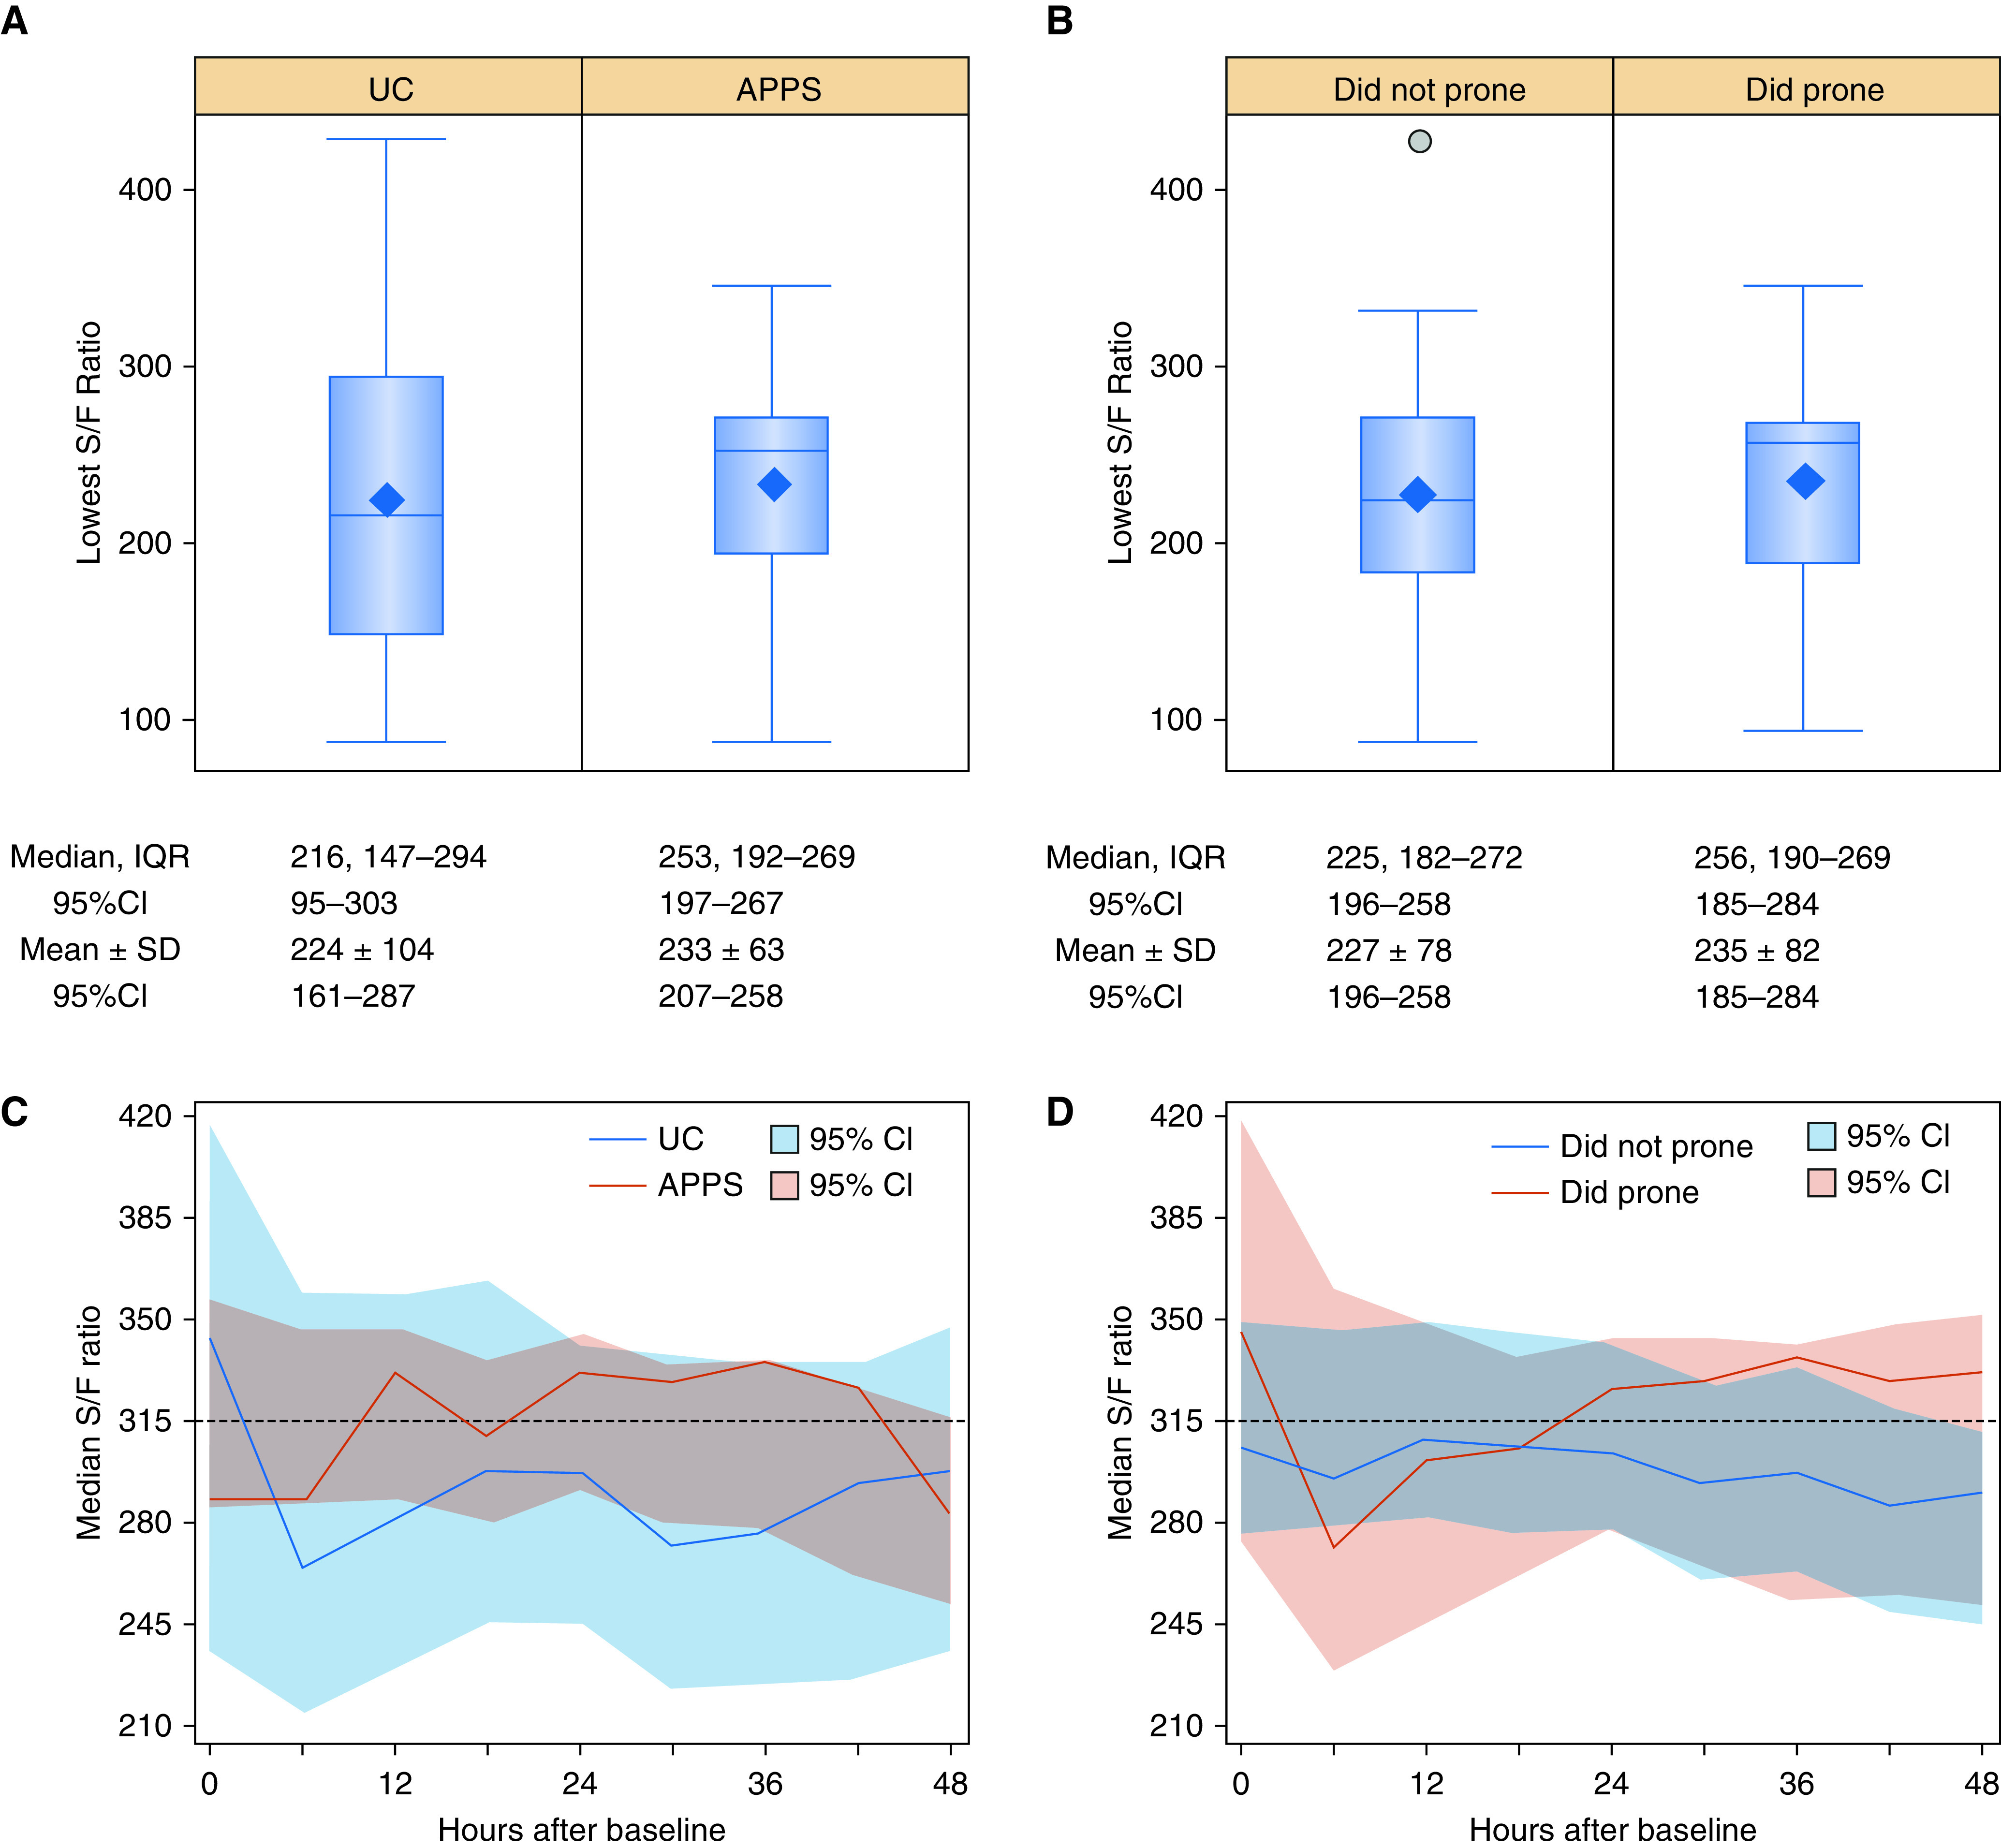
Figure 2.

Separation of lowest S/F ratio and trends in median S/F ratio within 48 hours from baseline for patients with coronavirus disease (COVID-19) acute respiratory failure enrolled into the APPS pilot trial. Box and whisker plots depict the lowest S/F ratio for (A) patients randomly assigned to UC and APPS and (B) patients who did not prone and did prone. Median and IQR and mean and SD estimates along with 95% CIs are shown below the plot for each group. Outlier data points are presented with a circle for any estimates located at least 1.5 times the IQR below the first quartile or above the third quartile. The group median S/F ratio is shown plotted longitudinally at 6-hour intervals for (C) patients randomly assigned to UC and APPS and (D) patients who did not prone and did prone. APPS = Awake Prone Positioning Strategy; CI = confidence interval; IQR = interquartile range; SD = standard deviation; S/F = oxygen saturation to fraction of inspired oxygen; UC = usual care.
