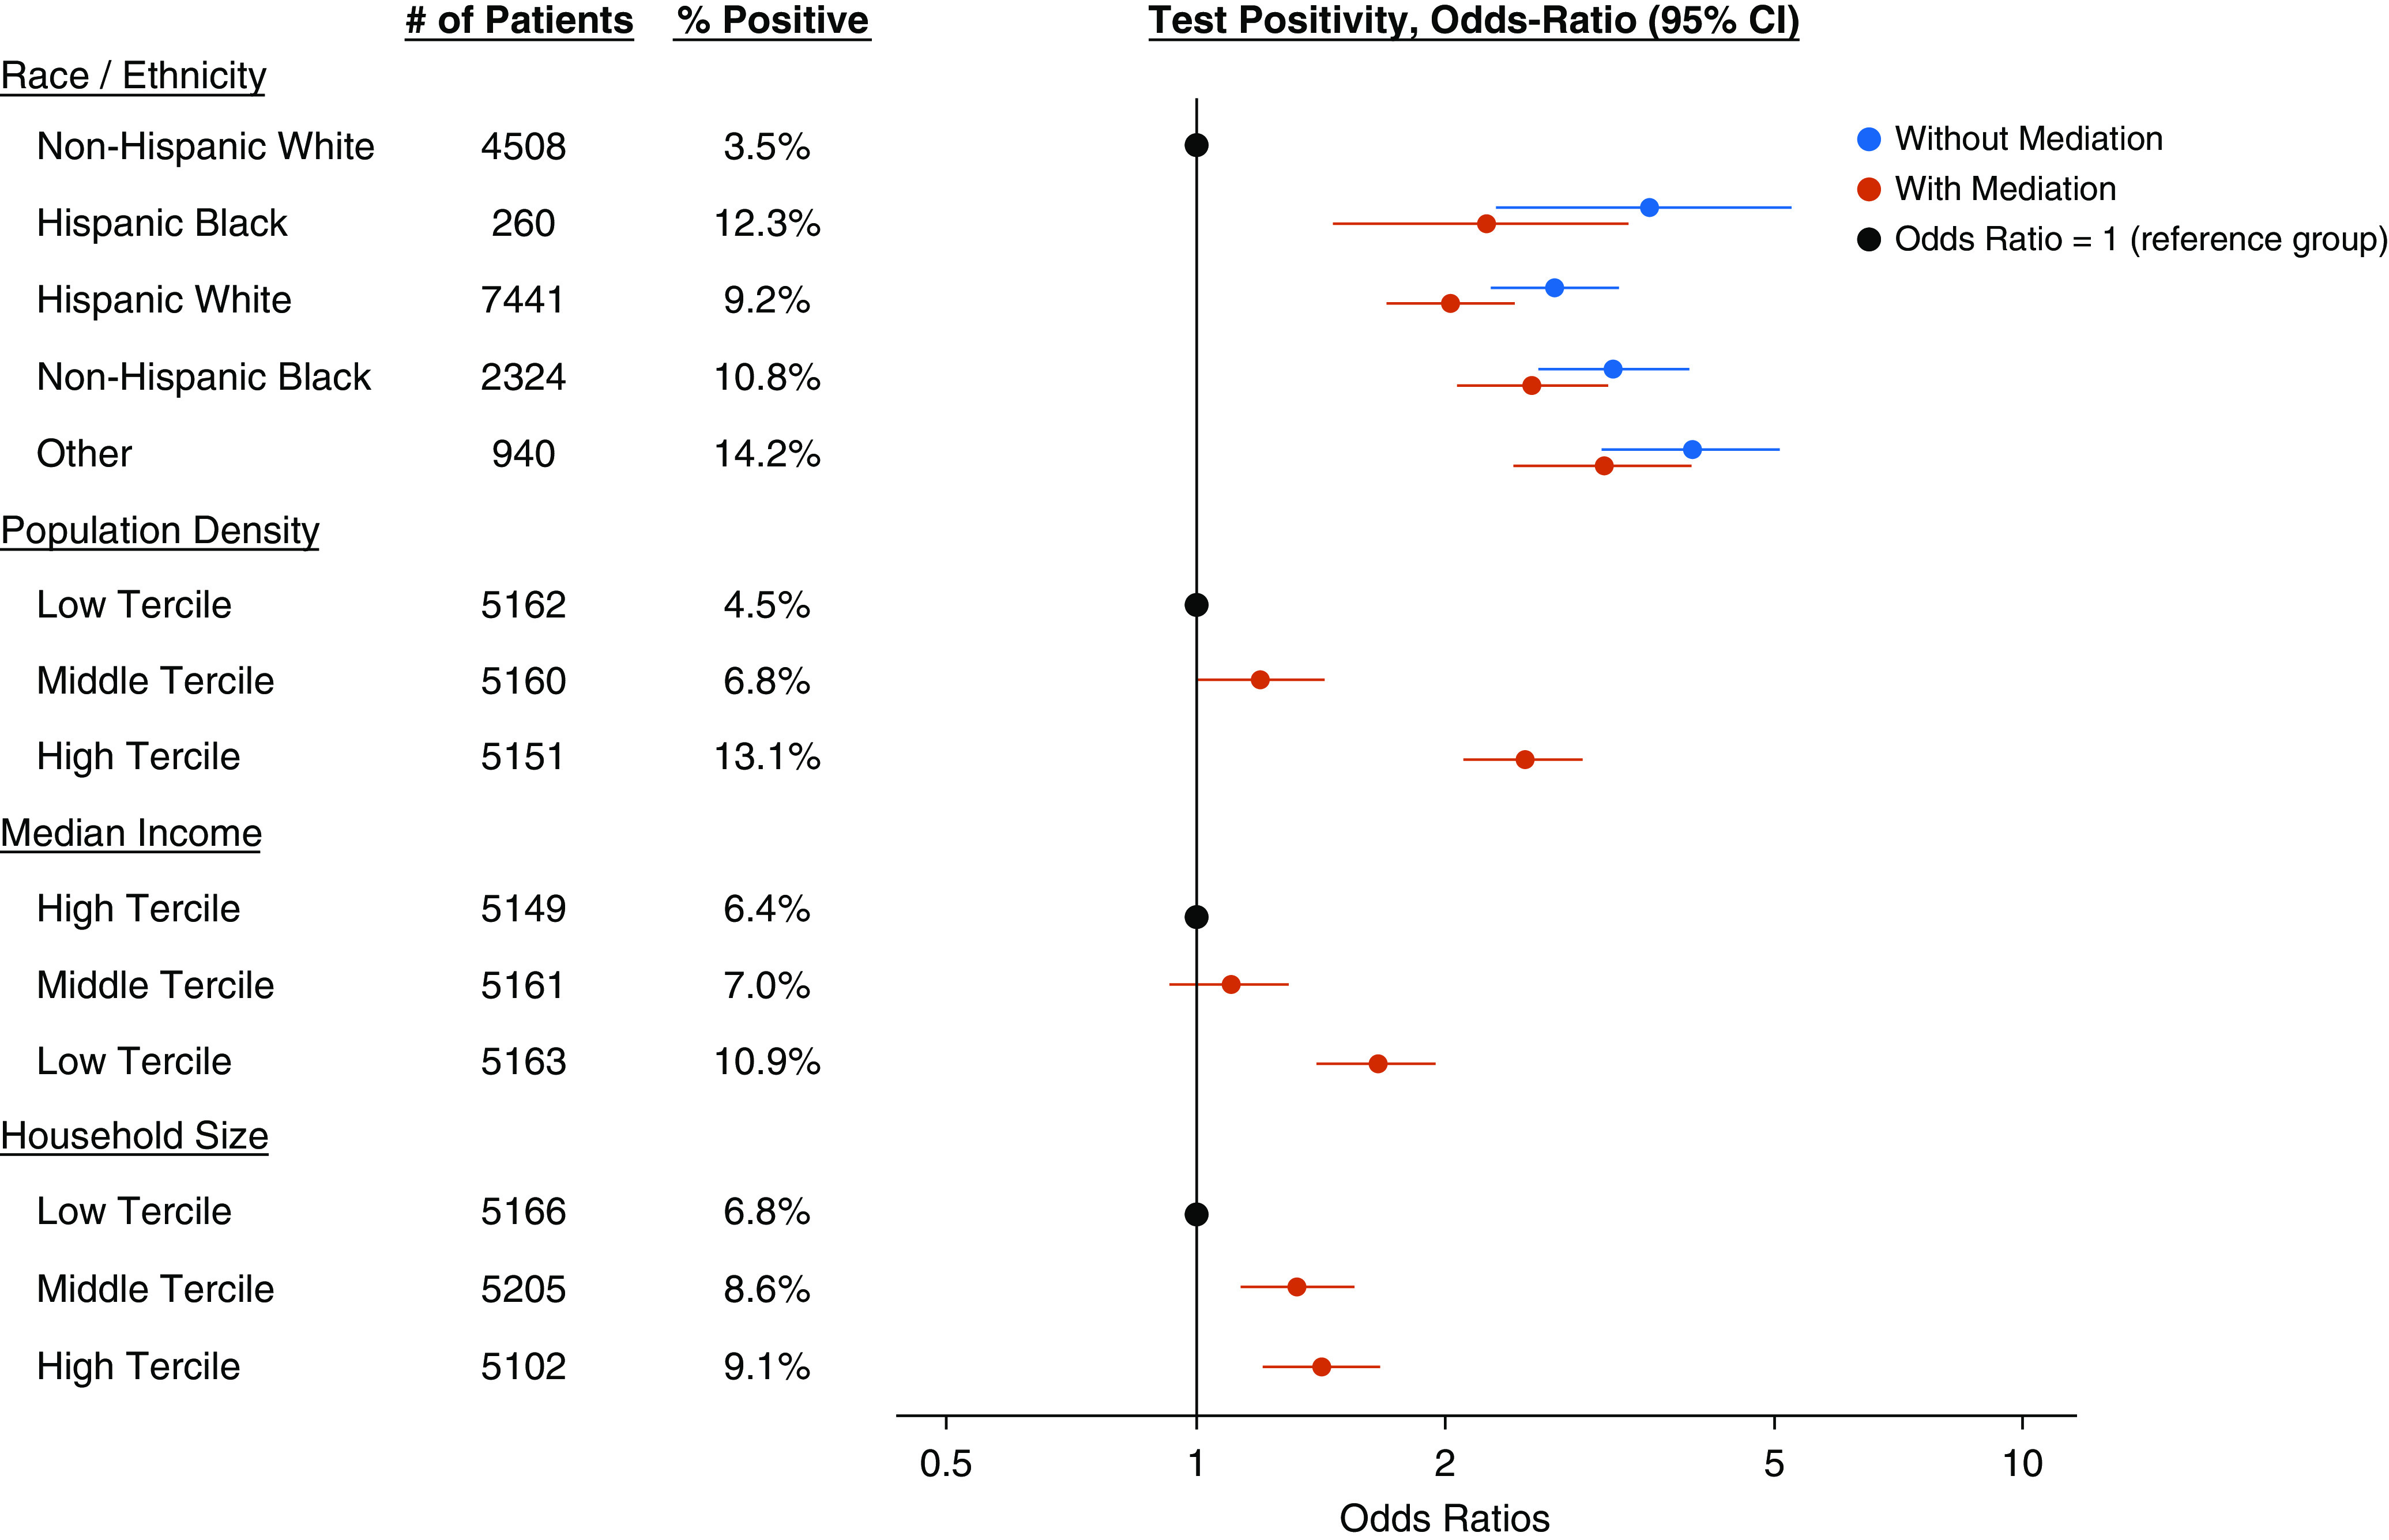
Figure 1.

Adjusted association of race/ethnicity with test positivity in the absence and presence of socioeconomic factors. The model is also adjusted for demographic factors (age, sex, and payor). CI = confidence interval.

Adjusted association of race/ethnicity with test positivity in the absence and presence of socioeconomic factors. The model is also adjusted for demographic factors (age, sex, and payor). CI = confidence interval.